
Article Categories
- All Categories
-
 Data Structure
-
 Networking
-
 RDBMS
RDBMS
-
 Operating System
-
 Java
Java
-
 MS Excel
-
 iOS
iOS
-
 HTML
HTML
-
 CSS
CSS
-
 Android
-
 Python
-
 C Programming
-
 C++
C++
-
 C#
C#
-
 MongoDB
-
 MySQL
MySQL
-
 Javascript
-
 PHP
PHP
-
 Economics & Finance
Selected Reading
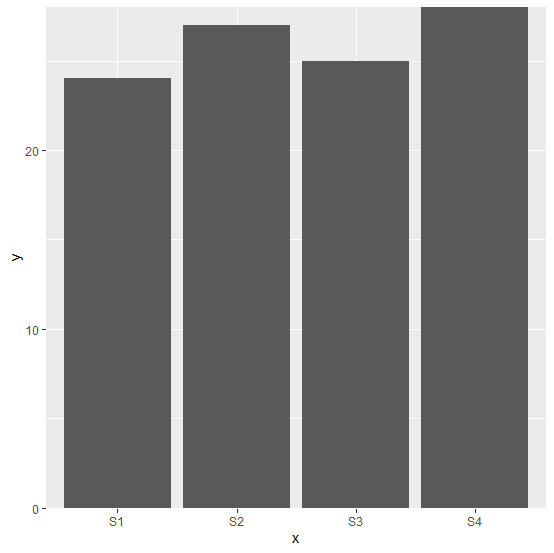
How to align the bars of a barplot with the X-axis using ggplot2 in R?
The bar plot is created with geom_bar function but there always exist some space between the bars and the X-axis labels. If we want to reduce that space or completely remove it we need to use scale_y_continuous function by defining expand argument for former and scale_y_continuous(expand=c(0,0)) for latter.
Example
ggplot(df,aes(x,y))+geom_bar(stat="identity")+scale_y_continuous(expand=c(0,0))
Output

Updated on: 2026-03-11T23:22:53+05:30
2K+ Views

Advertisements