
Article Categories
- All Categories
-
 Data Structure
-
 Networking
-
 RDBMS
RDBMS
-
 Operating System
-
 Java
Java
-
 MS Excel
-
 iOS
iOS
-
 HTML
HTML
-
 CSS
CSS
-
 Android
-
 Python
-
 C Programming
-
 C++
C++
-
 C#
C#
-
 MongoDB
-
 MySQL
MySQL
-
 Javascript
-
 PHP
PHP
-
 Economics & Finance
Selected Reading
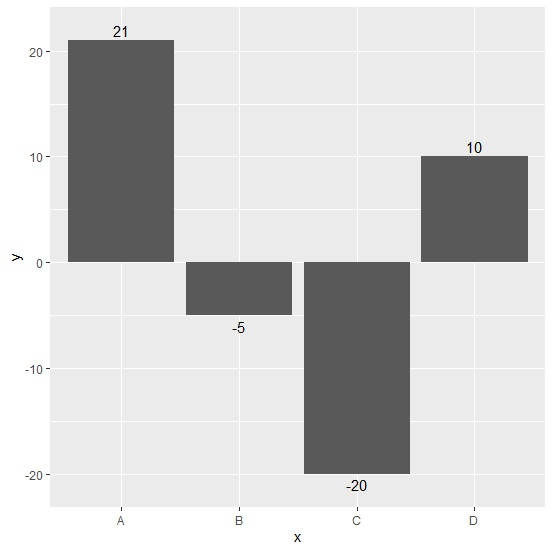
How to display negative labels below bars in barplot using ggplot2 in R?
Be default, the labels on the plot are represented without sign in a barplot that is created by using ggplot2 but we might want to display the sign of the labels especially in cases where we have some negative values. This can be done with the help of geom_text function of ggplot2 package as shown in the below example.
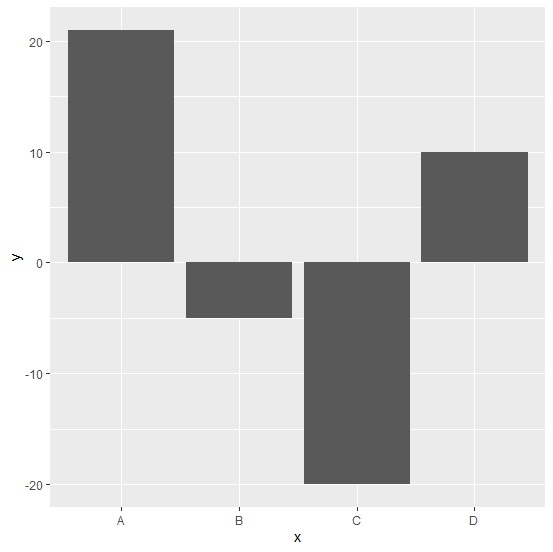
Consider the below data frame −
Example
x<-c("A","B","C","D")
y<-c(21,-5,-20,10)
df<-data.frame(x,y)
df
Output
   x   y
1  A   21
2  B  -5
3  C  -20
4  D   10
Loading ggplot2 package and creating bar chart for data in df −
Example
library(ggplot2)
ggplot(df,aes(x,y))+geom_bar(stat="identity")
Output
Creating bar chart for data in df with negative labels displayed with negative sign −
Example
ggplot(df,aes(x,y))+geom_bar(stat="identity")+geom_text(aes(y=y+sign(y),label=y))
Output

Updated on: 2026-03-11T22:50:55+05:30
1K+ Views

Advertisements