
Article Categories
- All Categories
-
 Data Structure
-
 Networking
-
 RDBMS
RDBMS
-
 Operating System
-
 Java
Java
-
 MS Excel
-
 iOS
iOS
-
 HTML
HTML
-
 CSS
CSS
-
 Android
-
 Python
-
 C Programming
-
 C++
C++
-
 C#
C#
-
 MongoDB
-
 MySQL
MySQL
-
 Javascript
-
 PHP
PHP
-
 Economics & Finance
Selected Reading
How to change the space between bars in a barplot in R?
By default, the space between bars is equal irrespective of the number of bars in the plot. If we want to have different space between bars then space arguments need to be used inside the barplot function but the first value does not make an impact because the first space is fixed between Y-axis and the first bar. For example, if we have a vector x that contains three values then the barplot with different space between bars can be created by using the below command −
barplot(x,space=c(0.5,0.1,0.5))
Example
x<-rpois(4,5)
x
Output
[1] 3 8 4 4
Example
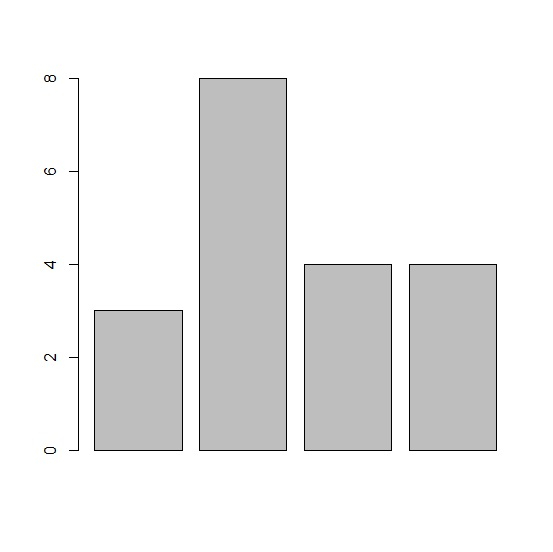
barplot(x)
Output
Example
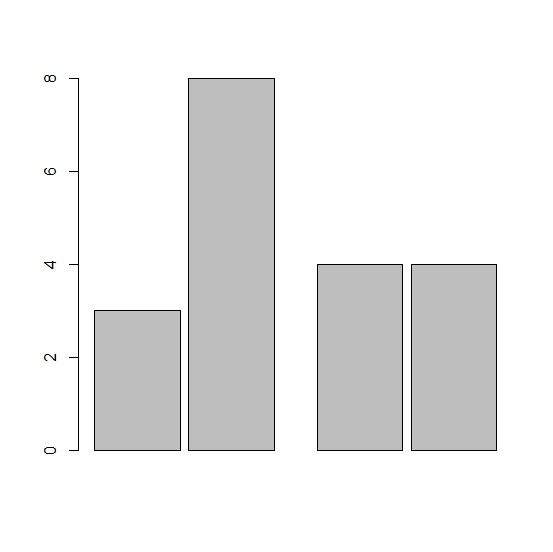
barplot(x,space=c(0.01,0.1,0.5,0.1))
Output
Example
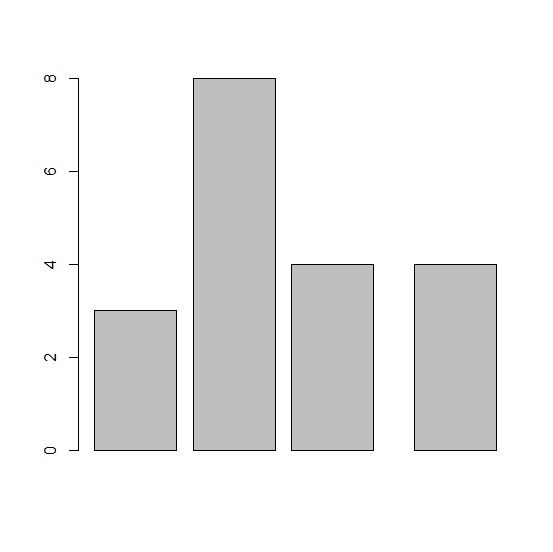
barplot(x,space=c(0.1,0.2,0.2,0.5))
Output

Updated on: 2026-03-11T22:50:55+05:30
914 Views

Advertisements