
Article Categories
- All Categories
-
 Data Structure
-
 Networking
-
 RDBMS
RDBMS
-
 Operating System
-
 Java
Java
-
 MS Excel
-
 iOS
iOS
-
 HTML
HTML
-
 CSS
CSS
-
 Android
-
 Python
-
 C Programming
-
 C++
C++
-
 C#
C#
-
 MongoDB
-
 MySQL
MySQL
-
 Javascript
-
 PHP
PHP
-
 Economics & Finance
Selected Reading
How to create a barplot with one of the bars having different color in R?
A bar plot represents discrete data and the bars in the bar plot are usually of same color but we might want to highlight a particular bar based on the characteristics of the data or the objective of the analysis project. For example, if a particular bar represents highly severe situation or highly unimportant situation then we can change the color that particular bar so that people can easily point out that bar.
Consider the below data frame −
Example
x<-c("X1","X2","X3","X4")
freq<-c(56,53,55,57)
df<-data.frame(x,freq)
df
Output
x freq
1 X1 56
2 X2 53
3 X3 55
4 X4 57
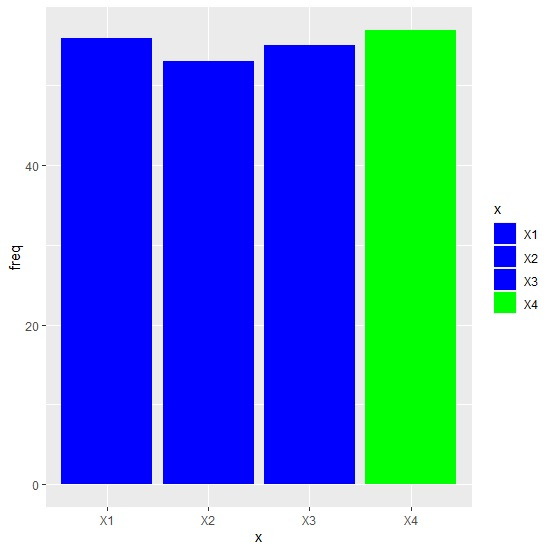
Loading ggplot2 package and creating bar plot with green color for bar showing 57 −
Example
library(ggplot2) ggplot(df,aes(x,freq,fill=x))+geom_bar(stat="identity")+ scale_fill_manual(values=c("blue","blue","blue","green"))
Output
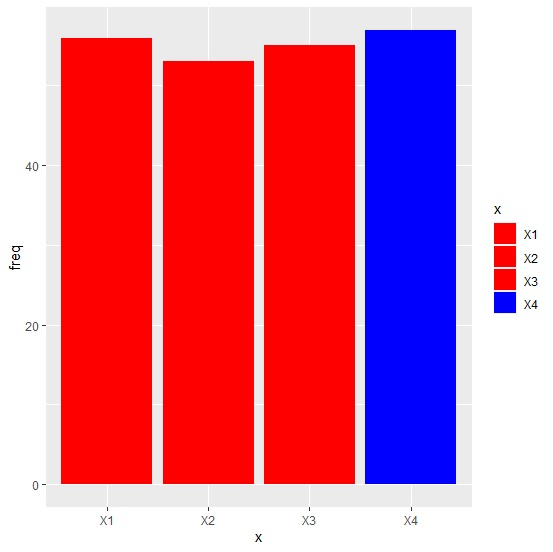
Creating bar plot with blue color for bar showing 57 −
Example
ggplot(df,aes(x,freq,fill=x))+geom_bar(stat="identity")+ scale_fill_manual(values=c("red","red","red","blue"))
Output

Updated on: 2026-03-11T22:50:52+05:30
647 Views

Advertisements