- Chart.js - Home
- Chart.js - Introduction
- Chart.js - Installation
- Chart.js - Syntax
- Chart.js - Basics
- Chart.js - Color
- Chart.js - Options
- Chart.js - Interactions
- Chart.js - Legend
- Chart.js - Title
- Chart.js - Animation
- Chart.js - Tooltip
- Chart.js - Line Chart
- Chart.js - Bar Chart
- Chart.js - Radar Chart
- Chart.js - Doughnut Chart
- Chart.js - Pie Chart
- Chart.js - Polar Area Chart
- Chart.js - Bubble Chart
- Chart.js - Scatter Chart
- Chart.js - Mixed Chart
- Chart.js - Cartesian Axis
- Chart.js - Category Axis
- Chart.js - Radial Axis
- Chart.js Useful Resources
- Chart.js - Quick Guide
- Chart.js - Useful Resources
- Chart.js - Discussion
Selected Reading
Chart.js - Tooltip
Chart.js Tooltip provides us an option to show tooltip text in our chart. Tooltip is a graphical UI element that provides extra information as we hover the mouse over the chart elements. The namespace for Animation configuration is options.plugins.tooltip.
Syntax
The Chart Tooltip syntax is given below −
options: {
   plugins: {
      tooltip: {
         enabled: true,
         (Write tooltip's style element)
      },
   }
}
The tooltip enabled property must be true to display the data label. If it sets to false, then the tooltip becomes deactivated.
Example
Lets take an example in which we will be using various Tooltip configurations −
<!DOCTYPE>
<html>
<head>
   <meta charset- "UTF-8" />
   <meta name="viewport" content="width=device-width, initial-scale=1" />
   <title>chart.js</title>
</head>
<body>
   <canvas id="chartId" aria-label="chart" height="350" width="580"></canvas>
   <script src="https://cdnjs.cloudflare.com/ajax/libs/Chart.js/3.1.1/chart.min.js"></script>
   <script src="https://cdnjs.cloudflare.com/ajax/libs/Chart.js/3.1.1/helpers.esm.min.js"></script>
   <script>
      var chrt = document.getElementById("chartId").getContext("2d");
      var chartId = new Chart(chrt, {
         type: 'bar',
         data: {
            labels: ["HTML", "CSS", "JAVASCRIPT", "CHART.JS", "JQUERY", "BOOTSTRP"],
            datasets: [{
               label: "online tutorial subjects",
               data: [20, 40, 30, 35, 30, 20],
               backgroundColor: ['coral', 'aqua', 'pink', 'lightgreen', 'lightblue', 'crimson'],
               borderColor: ['red', 'blue', 'fuchsia', 'green', 'navy', 'black'],
               borderWidth: 2,
            }],
         },
         options: {
            responsive: false,
            plugins: {
               tooltip: {
                  enabled: true,
                  usePointStyle: true,
                  titleAlign: 'center',
                  titleColor: 'gold',
                  titleSpacing: 3,
                  TitleFont: {
                     weight: 'bold'
                  },
                  backgroundColor: 'midnightblue',
                  bodyColor: 'orange',
                  bodyAlign: 'center',
                  bodyFont: {
                     weight: 'italic'
                  },
                  callbacks: {
                     labelPointStyle: function(context) {
                        return {
                           pointStyle: 'circle',
                           rotation: 0
                        };
                     },
                  }
               }
            }
         },
      });
   </script>
</body>
</html>
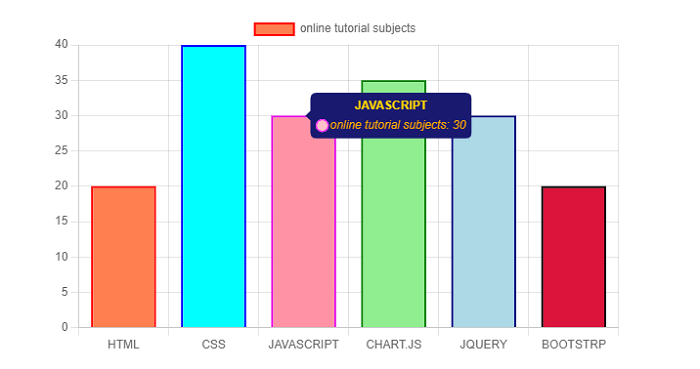
Use the "Edit and Run" option to execute the code online and then hover the mouse over the bars and observe the styling of the tooltips.
Output
The following output chart shows the various Tooltip configurations −

Advertisements