- Chart.js - Home
- Chart.js - Introduction
- Chart.js - Installation
- Chart.js - Syntax
- Chart.js - Basics
- Chart.js - Color
- Chart.js - Options
- Chart.js - Interactions
- Chart.js - Legend
- Chart.js - Title
- Chart.js - Animation
- Chart.js - Tooltip
- Chart.js - Line Chart
- Chart.js - Bar Chart
- Chart.js - Radar Chart
- Chart.js - Doughnut Chart
- Chart.js - Pie Chart
- Chart.js - Polar Area Chart
- Chart.js - Bubble Chart
- Chart.js - Scatter Chart
- Chart.js - Mixed Chart
- Chart.js - Cartesian Axis
- Chart.js - Category Axis
- Chart.js - Radial Axis
- Chart.js Useful Resources
- Chart.js - Quick Guide
- Chart.js - Useful Resources
- Chart.js - Discussion
Chart.js - Pie Chart
Chart.js pie chart is another most used charts to represent the data sets. Like doughnut charts, pie charts are also divided into various segments in which the arc of each segment shows the proportional value of each piece of data. If you want to show the relational proportions between data, pie chart is also an excellent choice.
The difference between doughnut and pie chart is in their value of cutout that equates to what portion of the inner should be cut out. For pie charts, the default value of cutout is 0, whereas for doughnut charts, it is 50%.
Following are the namespaces to be used in pie chart for dataset properties −
data.datasets[index] − It provides options for this dataset only.
options.datasets.pie − It provides options for all pie datasets.
options.elements.arc − It provides options for all the arc elements.
Options − It provides options for the whole chart
We need to use type: "pie" for creating the pie chart.
Example
Lets take an example with the help of which we will create a pie chart −
<!DOCTYPE>
<html>
<head>
<meta charset- "UTF-8" />
<meta name="viewport" content="width=device-width, initial-scale=1" />
<title>chart.js</title>
</head>
<body>
<canvas id="chartId" aria-label="chart" height="350" width="580"></canvas>
<script src="https://cdnjs.cloudflare.com/ajax/libs/Chart.js/3.1.1/chart.min.js"></script>
<script>
var chrt = document.getElementById("chartId").getContext("2d");
var chartId = new Chart(chrt, {
type: 'pie',
data: {
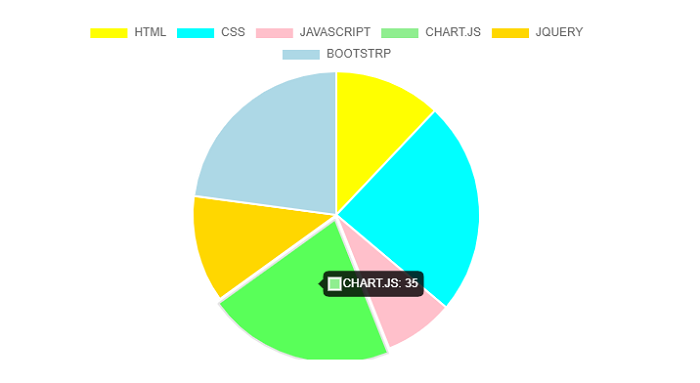
labels: ["HTML", "CSS", "JAVASCRIPT", "CHART.JS", "JQUERY", "BOOTSTRP"],
datasets: [{
label: "online tutorial subjects",
data: [20, 40, 13, 35, 20, 38],
backgroundColor: ['yellow', 'aqua', 'pink', 'lightgreen', 'gold', 'lightblue'],
hoverOffset: 5
}],
},
options: {
responsive: false,
},
});
</script>
</body>
</html>
Output
It will produce the following pie chart as the output −