- Chart.js - Home
- Chart.js - Introduction
- Chart.js - Installation
- Chart.js - Syntax
- Chart.js - Basics
- Chart.js - Color
- Chart.js - Options
- Chart.js - Interactions
- Chart.js - Legend
- Chart.js - Title
- Chart.js - Animation
- Chart.js - Tooltip
- Chart.js - Line Chart
- Chart.js - Bar Chart
- Chart.js - Radar Chart
- Chart.js - Doughnut Chart
- Chart.js - Pie Chart
- Chart.js - Polar Area Chart
- Chart.js - Bubble Chart
- Chart.js - Scatter Chart
- Chart.js - Mixed Chart
- Chart.js - Cartesian Axis
- Chart.js - Category Axis
- Chart.js - Radial Axis
- Chart.js Useful Resources
- Chart.js - Quick Guide
- Chart.js - Useful Resources
- Chart.js - Discussion
Chart.js - Basics
To understand the basics of chart.js, lets go step-by-step and see how to create a simple bar chart using chart.js library −
Step 1 − First we need to create a canvas id using canvas object. Here we can add various styles and HTML elements. We also need to provide the height and width of our graph or chart. Lets see how we can create it −
<canvas id="chartId" aria-label = "chart" height="500" width = "500"></canvas>
Step 2 − Now, we need to access the canvas Id and chart.js object as follows −
var chrt = document.getElementById("chartId").getContext("2d");
Step 3 − Next use the Chart.js Type object to specify what type of chart or graph you need. There are various types of graphs you can choose from.
type: 'bar',
Step 4 − If you want to give labels to the elements of the graph or chart, you can use Chart.js "labels" object as follows −
labels: ["HTML", "CSS", "JAVASCRIPT", "CHART.JS", "JQUERY", "BOOTSTRP"],
Likewise, you can also provide the label of the graph or chart using the label object as follows −
label: "Online Tutorial Subjects"
Step 5 − For graph, give the values of elements of your graph or chart. It can be done with the help of data object as follows −
data: [20, 40, 30, 10, 40, 20]
Step 6 − You can also apply some advance features like animation, responsive etc. by using the options object as follows −
options: {
   responsive: false,
},
Example
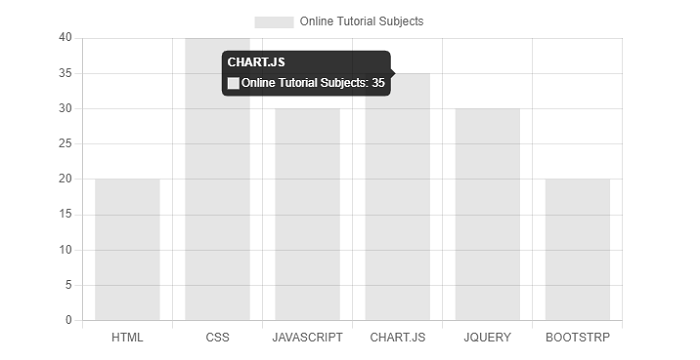
In this example, we will create a bar graph showing various subjects for online tutorials.
<!DOCTYPE>
<html>
<head>
   <meta charset- "UTF-8" />
   <meta name="viewport" content="width=device-width, initial-scale=1" />
   <title>chart.js</title>
</head>
<body>
   <canvas id="chartId" aria-label="chart" height="350" width="580"></canvas>
   <script src="https://cdnjs.cloudflare.com/ajax/libs/Chart.js/3.1.1/chart.min.js"></script>
   <script src="https://cdnjs.cloudflare.com/ajax/libs/Chart.js/3.1.1/helpers.esm.min.js"></script>
   <script>
      var chrt = document.getElementById("chartId").getContext("2d");
      var chartId = new Chart(chrt, {
         type: 'bar',
         data: {
            labels: ["HTML", "CSS", "JAVASCRIPT", "CHART.JS", "JQUERY", "BOOTSTRP"],
            datasets: [{
               label: "Online Tutorial Subjects",
               data: [20, 40, 30, 35, 30, 20],
            }],
         },
         options: {
            responsive: false,
         },
      });
   </script>
</body>
</html>
Output