- Chart.js - Home
- Chart.js - Introduction
- Chart.js - Installation
- Chart.js - Syntax
- Chart.js - Basics
- Chart.js - Color
- Chart.js - Options
- Chart.js - Interactions
- Chart.js - Legend
- Chart.js - Title
- Chart.js - Animation
- Chart.js - Tooltip
- Chart.js - Line Chart
- Chart.js - Bar Chart
- Chart.js - Radar Chart
- Chart.js - Doughnut Chart
- Chart.js - Pie Chart
- Chart.js - Polar Area Chart
- Chart.js - Bubble Chart
- Chart.js - Scatter Chart
- Chart.js - Mixed Chart
- Chart.js - Cartesian Axis
- Chart.js - Category Axis
- Chart.js - Radial Axis
- Chart.js Useful Resources
- Chart.js - Quick Guide
- Chart.js - Useful Resources
- Chart.js - Discussion
Selected Reading
Chart.js - Options
In Chart.js, using a context dependent route, the Options are resolved from top of the code to the bottom of it. We have different levels of options as shown below −
Chart Level Options
We have three chart level options −
- options
- overrides
- defaults
Dataset Level Options
Chart.js provides us below options to be used at dataset level −
- dataset
- options.datasets
- options
- overrides
- defaults.datasets
- defaults
Dataset Animation Options
Chart.js provides us below options to be used at dataset animation level −
- Dataset.animation
- options.datasets.animation
- options.animation
- overrides.datasets.animation
- defaults.datasets.animation
- defaults.animation
Dataset Element Level Options
Chart.js provides us below options to be used at dataset element level −
- Dataset
- options.datasets
- options.datasets.elements
- options.elements
- options
- overrides.datasets
- overrides.datasets.elements
- defaults.datasets
- defaults.datasets.elements
- defaults.elements
- defaults
Scale Options
Chart.js provides us below scale options −
- options.scale
- overrides.scales
- overrides.datasets.elements
- defaults.scales
- defaults.scale
Plugin Options
Chart.js provides us below plugin options that provides array of paths to additionally look for its options in −
- options.scale
- options.plugins[plugin.id]
- (options.[...plugin.additionalOptionScopes])
- overrides[config.type].plugins[plugin.id]
- defaults.plugins[plugin.id]
- (defaults.[...plugin.additionalOptionScopes])
Example
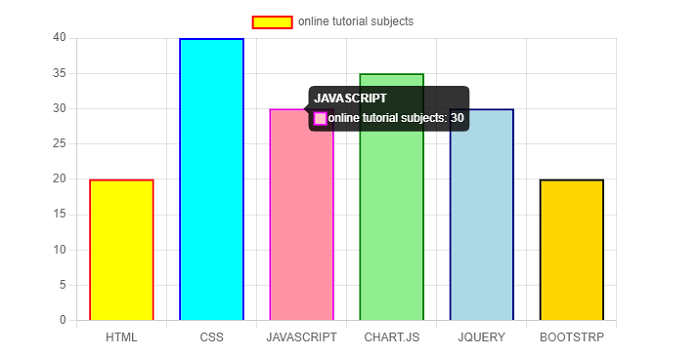
Lets take an example in which we will use various Options in our chart −
<!DOCTYPE>
<html>
<head>
   <meta charset- "UTF-8" />
   <meta name="viewport" content="width=device-width, initial-scale=1" />
   <title>chart.js</title>
</head>
<body>
   <canvas id="chartId" aria-label="chart" height="350" width="580"></canvas>
   <script src="https://cdnjs.cloudflare.com/ajax/libs/Chart.js/3.1.1/chart.min.js"></script>
   <script>
      var chrt = document.getElementById("chartId").getContext("2d");
      var chartId = new Chart(chrt, {
         type: 'bar',
         data: {
            labels: ["HTML", "CSS", "JAVASCRIPT", "CHART.JS", "JQUERY", "BOOTSTRP"],
            datasets: [{
            label: "online tutorial subjects",
            data: [20, 40, 30, 35, 30, 20],
            backgroundColor: ['yellow', 'aqua', 'pink', 'lightgreen', 'lightblue', 'gold'],
            borderColor: ['red', 'blue', 'fuchsia', 'green', 'navy', 'black'],
            borderWidth: 2,
            }],
         },
         options: {
            responsive: false,
            layout: {
               padding: {
                  left: 40,
                  right: 40,
               }
            },
            plugins: {
               legend: {
                  labels: {
                     font: {
                        size: 25,
                        family: 'Helvetica',
                        style: 'bold',
                     }
                  }
               }
            }
         },
      });
   </script>
</body>
</html>
Output
The following output chart shows padding of the element and font style −

Advertisements