- Chart.js - Home
- Chart.js - Introduction
- Chart.js - Installation
- Chart.js - Syntax
- Chart.js - Basics
- Chart.js - Color
- Chart.js - Options
- Chart.js - Interactions
- Chart.js - Legend
- Chart.js - Title
- Chart.js - Animation
- Chart.js - Tooltip
- Chart.js - Line Chart
- Chart.js - Bar Chart
- Chart.js - Radar Chart
- Chart.js - Doughnut Chart
- Chart.js - Pie Chart
- Chart.js - Polar Area Chart
- Chart.js - Bubble Chart
- Chart.js - Scatter Chart
- Chart.js - Mixed Chart
- Chart.js - Cartesian Axis
- Chart.js - Category Axis
- Chart.js - Radial Axis
- Chart.js Useful Resources
- Chart.js - Quick Guide
- Chart.js - Useful Resources
- Chart.js - Discussion
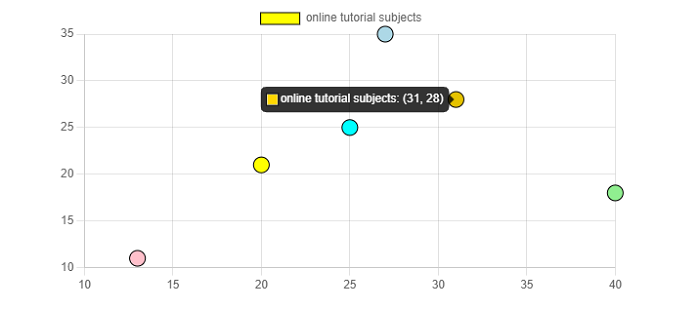
Chart.js - Bubble Chart
Chart.js provides us a way to display three dimensional of data at the same time with the help of bubble chart. First two dimensions of the bubble and corresponding horizontal and vertical axes determines the location of the bubble in chart. Whereas the third dimension is represented by the size of the bubble.
Below are the namespaces to be used in bubble chart for dataset properties −
data.datasets[index] − It provides options for this dataset only.
options.datasets.bubble − It provides options for all bubble datasets.
options.elements.point − It provides options for all the point elements.
Options − It provides options for the whole chart
We need to use type: "bubble" for creating the bubble chart.
Example
Lets take an example with the help of which we will create a bubble chart −
<!DOCTYPE>
<html>
<head>
   <meta charset- "UTF-8" />
   <meta name="viewport" content="width=device-width, initial-scale=1" />
   <title>chart.js</title>
</head>
<body>
   <canvas id="chartId" aria-label="chart" height="300" width="580"></canvas>
   <script src="https://cdnjs.cloudflare.com/ajax/libs/Chart.js/3.1.1/chart.min.js"></script>
   <script>
      var chrt = document.getElementById("chartId").getContext("2d");
      var chartId = new Chart(chrt, {
         type: 'bubble',
         data: {
            labels: ["HTML", "CSS", "JAVASCRIPT", "CHART.JS", "JQUERY", "BOOTSTRP"],
            datasets: [{
               label: "online tutorial subjects",
               data: [{
                     x: 20,
                     y: 21,
                     z: 20
                  },
                  {
                     x: 25,
                     y: 25,
                     z: 25
                  },
                  {
                     x: 13,
                     y: 11,
                     z: 25
                  },
                  {
                     x: 40,
                     y: 18,
                     z: 25
                  },
                  {
                     x: 31,
                     y: 28,
                     z: 25
                  },
                  {
                     x: 27,
                     y: 35,
                     z: 35
                  }
               ],
               backgroundColor: ['yellow', 'aqua', 'pink', 'lightgreen', 'gold', 'lightblue'],
               borderColor: ['black'],
               radius: 8,
            }],
         },
         options: {
         responsive: false,
         },
      });
   </script>
</body>
</html>
Output