- Chart.js - Home
- Chart.js - Introduction
- Chart.js - Installation
- Chart.js - Syntax
- Chart.js - Basics
- Chart.js - Color
- Chart.js - Options
- Chart.js - Interactions
- Chart.js - Legend
- Chart.js - Title
- Chart.js - Animation
- Chart.js - Tooltip
- Chart.js - Line Chart
- Chart.js - Bar Chart
- Chart.js - Radar Chart
- Chart.js - Doughnut Chart
- Chart.js - Pie Chart
- Chart.js - Polar Area Chart
- Chart.js - Bubble Chart
- Chart.js - Scatter Chart
- Chart.js - Mixed Chart
- Chart.js - Cartesian Axis
- Chart.js - Category Axis
- Chart.js - Radial Axis
- Chart.js Useful Resources
- Chart.js - Quick Guide
- Chart.js - Useful Resources
- Chart.js - Discussion
Chart.js - Interactions
Chart.js interactions help us to communicate with the elements of our chart. You can apply these interactions using both the hover and tooltip. The table below gives the descriptions of various kinds of interactions we can use −
| Name | Type | Default | Description |
|---|---|---|---|
| Mode | string | 'nearest' | It will set which elements appear in the interaction. |
| Intersect | Boolean | true | Intersect can be used to set the mouse position. If you keep this true, the interaction mode only applies when the mouse position intersects an item on the chart else not. |
| Axis | string | 'x' | Axis can be set to 'x', 'y', 'xy' or 'r'. It defines the directions are used in calculating distances. For index mode the default value is 'x'. Whereas 'xy' is the default value for 'nearest' modes. |
| includeInvisible | Boolean | false | if false, the invisible points that are outside of the chart area will not be included when evaluating interactions. |
The namespace to use interactions in our charts is "options.interactions".
On the similar note, the following table gives the descriptions how the chart will interact with events −
| Name | Type | Default | Description |
|---|---|---|---|
| Events | string[] | ['mousemove', 'mouseout', 'click', 'touchstart', 'touchmove'] | This option defines the browser events that the chart should listen. |
| onHover | function | Null | This event will be called when any of the events fire over our chartArea.). |
| onClick | function | Null | This event will be called if the event is of type
'mouseup', 'click' or 'contextmenu' over our chartArea. |
Syntax
The interaction syntax is given below −
interaction: {
   mode: 'nearest',
}
And the Chart.js event syntax is given below −
events: ['click'],
Example
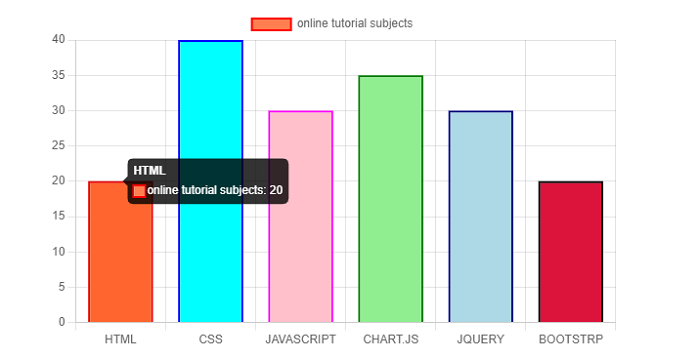
Lets take an example in which we will use various interactions and events in our chart −
<!DOCTYPE>
<html>
<head>
   <meta charset- "UTF-8" />
   <meta name="viewport" content="width=device-width, initial-scale=1" />
   <title>chart.js</title>
</head>
<body>
   <canvas id="chartId" aria-label="chart" height="350" width="580"></canvas>
   <script src="https://cdnjs.cloudflare.com/ajax/libs/Chart.js/3.1.1/chart.min.js"></script>
   <script>
      var chrt = document.getElementById("chartId").getContext("2d");
      var chartId = new Chart(chrt, {
         type: 'bar',
         data: {
            labels: ["HTML", "CSS", "JAVASCRIPT", "CHART.JS", "JQUERY", "BOOTSTRP"],
            datasets: [{
               label: "online tutorial subjects",
               data: [20, 40, 30, 35, 30, 20],
               backgroundColor: ['coral', 'aqua', 'pink', 'lightgreen', 'lightblue', 'crimson'],
               borderColor: ['red', 'blue', 'fuchsia', 'green', 'navy', 'black'],
               borderWidth: 2,
            }],
         },
         options: {
            responsive: false,
            events: ['click'],
            interaction: {
               mode: 'nearest',
            }
         },
      });
   </script>
</body>
</html>
Output
It will produce the following chart having various interactions and events −