- Chart.js - Home
- Chart.js - Introduction
- Chart.js - Installation
- Chart.js - Syntax
- Chart.js - Basics
- Chart.js - Color
- Chart.js - Options
- Chart.js - Interactions
- Chart.js - Legend
- Chart.js - Title
- Chart.js - Animation
- Chart.js - Tooltip
- Chart.js - Line Chart
- Chart.js - Bar Chart
- Chart.js - Radar Chart
- Chart.js - Doughnut Chart
- Chart.js - Pie Chart
- Chart.js - Polar Area Chart
- Chart.js - Bubble Chart
- Chart.js - Scatter Chart
- Chart.js - Mixed Chart
- Chart.js - Cartesian Axis
- Chart.js - Category Axis
- Chart.js - Radial Axis
- Chart.js Useful Resources
- Chart.js - Quick Guide
- Chart.js - Useful Resources
- Chart.js - Discussion
Chart.js - Animation
Chart.js animations are used to animate the charts or graphs. It provides us various options to configure the animations and to set the time for how much time animation will be shown. The namespace for Animation configuration is "options.animation".
The table below gives the descriptions of various kinds of configuration options we can use with chart animation −
| Name | Type | Default | Description |
|---|---|---|---|
| duration | number | 1000 | It will set the number of milliseconds an animation in the chart takes. |
| easing | string | 'easeOutQuart' | It is the easing function which we will use for animations. Some options are linear, easeInQuad, easeOutQuad, easeInOutBounce, etc. |
| delay | number | undefined | As name implies, it represents the delay before starting the animations. |
| loop | Boolean | undefined | If true, the animations in chart will loop endlessly. |
Syntax
The Chart Animation syntax is given below −
animations: {
   tension: {
      duration: 750,
      easing: 'easeInBounce',
      from: 1,
      to: 0,
      loop: true
   }
},
scales: {
   y: {
      min: 0,
      max: 45,
   }
}
The animation "loop" property must be true to animate. If it sets to false, then the "animation" becomes deactivated.
Example
Lets take an example in which we will be using various Animation configurations −
<!DOCTYPE>
<html>
<head>
   <meta charset- "UTF-8" />
   <meta name="viewport" content="width=device-width, initial-scale=1" />
   <title> chart.js</title>
</head>
<body>
   <canvas id="toolTip" aria-label="chart" height="350" width="580"></canvas>
   <script src="https://cdnjs.cloudflare.com/ajax/libs/Chart.js/3.1.1/chart.min.js"></script>
   <script>
      var chartTooltip = document.getElementById("toolTip").getContext("2d");
      var toolTip = new Chart(chartTooltip, {
         type: "line",
         data: {
            labels: ["HTML", "CSS", "JAVASCRIPT", "CHART.JS", "JQUERY", "BOOTSTRP"],
            datasets: [{
            label: "online tutorial subjects",
            data: [20, 40, 30, 35, 30, 20],
            backgroundColor: ['coral', 'aqua', 'pink', 'lightgreen', 'lightblue', 'crimson'],
            borderColor: [
            "black",
            ],
            borderWidth: 1,
            pointRadius: 5,
            }],
         },
         options: {
            responsive: false,
            animations: {
               tension: {
               duration: 750,
               easing: 'easeInBounce',
               from: 1,
               to: 0,
               loop: true
               }
            },
            scales: {
               y: {
                  min: 0,
                  max: 45,
               }
            }
         }
      });
   </script>
</body>
</html>
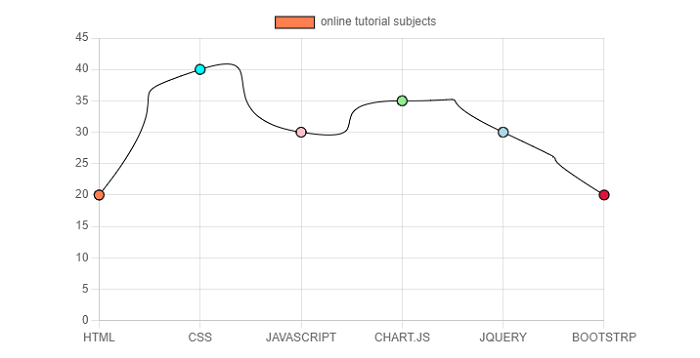
Output
Use the "Edit and Run" option to run the code and see how the chart behaves with the applied animations.
The following output chart shows the various Animations configurations −