- Chart.js - Home
- Chart.js - Introduction
- Chart.js - Installation
- Chart.js - Syntax
- Chart.js - Basics
- Chart.js - Color
- Chart.js - Options
- Chart.js - Interactions
- Chart.js - Legend
- Chart.js - Title
- Chart.js - Animation
- Chart.js - Tooltip
- Chart.js - Line Chart
- Chart.js - Bar Chart
- Chart.js - Radar Chart
- Chart.js - Doughnut Chart
- Chart.js - Pie Chart
- Chart.js - Polar Area Chart
- Chart.js - Bubble Chart
- Chart.js - Scatter Chart
- Chart.js - Mixed Chart
- Chart.js - Cartesian Axis
- Chart.js - Category Axis
- Chart.js - Radial Axis
- Chart.js Useful Resources
- Chart.js - Quick Guide
- Chart.js - Useful Resources
- Chart.js - Discussion
Selected Reading
Chart.js - Radial Axis
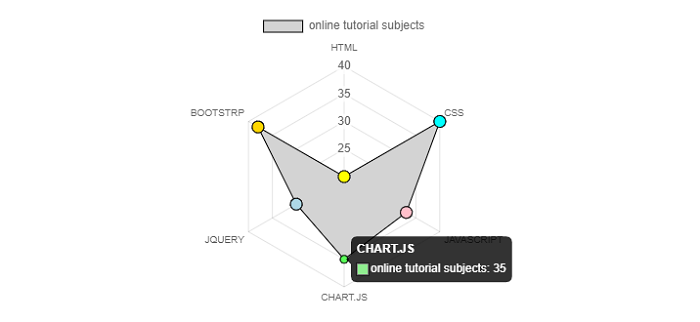
Radial axis is used in a radial chart such as a radar chart or polar area chart. This radial axis is basically a single axis that maps points in the angular and radial directions. Rather than being positioned on one of the edges of chart, radial axes overlay the chart area.
Example
Lets take an example in which we will use radial axes for creating a chart −
<!DOCTYPE>
<html>
<head>
   <meta charset- "UTF-8" />
   <meta name="viewport" content="width=device-width, initial-scale=1" />
   <title>chart.js</title>
</head>
<body>
   <canvas id="chartId" aria-label="chart" height="300" width="580"></canvas>
   <script src="https://cdnjs.cloudflare.com/ajax/libs/Chart.js/3.1.1/chart.min.js"></script>
   <script>
      var chrt = document.getElementById("chartId").getContext("2d");
      var chartId = new Chart(chrt, {
         type: 'radar',
         data: {
            labels: ["HTML", "CSS", "JAVASCRIPT", "CHART.JS", "JQUERY", "BOOTSTRP"],
            datasets: [{
               label: "online tutorial subjects",
               data: [20, 40, 33, 35, 30, 38],
               backgroundColor: ['lightgrey'],
               pointBackgroundColor: ['yellow', 'aqua', 'pink', 'lightgreen', 'lightblue', 'gold'],
               borderColor: ['black'],
               borderWidth: 1,
               pointRadius: 6,
            }],
         },
         options: {
            responsive: false,
            scales: {
               r: {
                  suggestedMin: 40,
                  suggestedMax: 40
               }
            }
         },
      });
   </script>
</body>
</html>
Output

Advertisements