- Chart.js - Home
- Chart.js - Introduction
- Chart.js - Installation
- Chart.js - Syntax
- Chart.js - Basics
- Chart.js - Color
- Chart.js - Options
- Chart.js - Interactions
- Chart.js - Legend
- Chart.js - Title
- Chart.js - Animation
- Chart.js - Tooltip
- Chart.js - Line Chart
- Chart.js - Bar Chart
- Chart.js - Radar Chart
- Chart.js - Doughnut Chart
- Chart.js - Pie Chart
- Chart.js - Polar Area Chart
- Chart.js - Bubble Chart
- Chart.js - Scatter Chart
- Chart.js - Mixed Chart
- Chart.js - Cartesian Axis
- Chart.js - Category Axis
- Chart.js - Radial Axis
- Chart.js Useful Resources
- Chart.js - Quick Guide
- Chart.js - Useful Resources
- Chart.js - Discussion
Selected Reading
Chart.js - Cartesian Axis
For any chart or graph, axes are an integral part. Basically, axes are used to determine how our data maps to a pixel value on the chart. A cartesian chart uses 1 or more X-axis and 1 or more Y-axis to map the data points on to two-dimensional (2-D) canvas. These axes are called cartesian axes.
Cartesian axis uses "options.scales.axis" namespace. The syntax of using cartesian axes is given below −
scales: {
   x: {
      grid: {
         color: 'orange',
         borderColor: 'orange',
      }
   }
}
Example
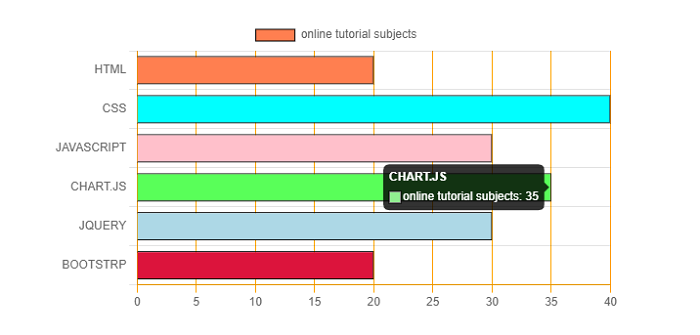
Lets take an example in which we will use Cartesian axes for creating a chart −
<!DOCTYPE>
<html>
<head>
   <meta charset- "UTF-8" />
   <meta name="viewport" content="width=device-width, initial-scale=1" />
   <title>chart.js</title>
</head>
<body>
   <canvas id="chartId" aria-label="chart" height="300" width="580"></canvas>
   <script src="https://cdnjs.cloudflare.com/ajax/libs/Chart.js/3.1.1/chart.min.js"></script>
   </script>
   <script>
      var chrt = document.getElementById("chartId").getContext("2d");
      var chartId = new Chart(chrt, {
         type: 'bar',
         data: {
            labels: ["HTML", "CSS", "JAVASCRIPT", "CHART.JS", "JQUERY", "BOOTSTRP"],
            datasets: [{
               label: "online tutorial subjects",
               data: [20, 40, 30, 35, 30, 20],
               backgroundColor: ['coral', 'aqua', 'pink', 'lightgreen', 'lightblue', 'crimson'],
               borderColor: ['black'],
               borderWidth: 1,
               pointRadius: 4,
            }],
         },
         options: {
            responsive: false,
            indexAxis: 'y',
            scales: {
               x: {
                  grid: {
                     color: 'orange',
                     borderColor: 'orange',
                  }
               }
            }
         },
      });
   </script>
</body>
</html>
Output

Advertisements