- Chart.js - Home
- Chart.js - Introduction
- Chart.js - Installation
- Chart.js - Syntax
- Chart.js - Basics
- Chart.js - Color
- Chart.js - Options
- Chart.js - Interactions
- Chart.js - Legend
- Chart.js - Title
- Chart.js - Animation
- Chart.js - Tooltip
- Chart.js - Line Chart
- Chart.js - Bar Chart
- Chart.js - Radar Chart
- Chart.js - Doughnut Chart
- Chart.js - Pie Chart
- Chart.js - Polar Area Chart
- Chart.js - Bubble Chart
- Chart.js - Scatter Chart
- Chart.js - Mixed Chart
- Chart.js - Cartesian Axis
- Chart.js - Category Axis
- Chart.js - Radial Axis
- Chart.js Useful Resources
- Chart.js - Quick Guide
- Chart.js - Useful Resources
- Chart.js - Discussion
Selected Reading
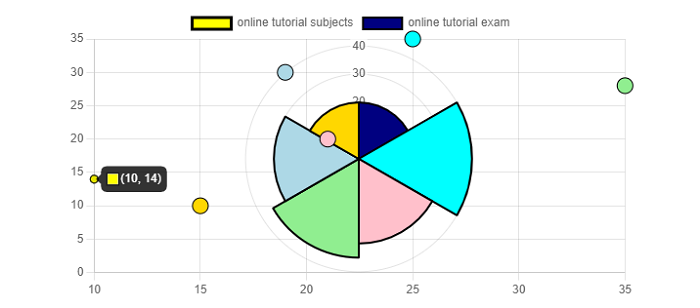
Chart.js - Mixed Chart
Chart.js also provides us a facility to create charts having combination of two or different chart types. Such charts are called mixed charts. One of the most common examples of chart.js mixed chart is a bar chart including a line dataset.
Syntax
The syntax for creating a mixed chart is given below −
type: 'scatter',
datasets: [
   { type: 'scatter', data: value, },
   { type: 'bar', data: value, },
]
Example
Lets take an example with the help of which we will create a mixed chart −
<!DOCTYPE>
<html>
<head>
   <meta charset- "UTF-8" />
   <meta name="viewport" content="width=device-width, initial-scale=1" />
   <title>chart.js</title>
</head>
<body>
   <canvas id="chartId" aria-label="chart" height="300" width="580"></canvas>
   <script src="https://cdnjs.cloudflare.com/ajax/libs/Chart.js/3.1.1/chart.min.js"></script>
   <script>
      var chrt = document.getElementById("chartId").getContext("2d");
      var chartId = new Chart(chrt, {
         type: 'scatter',
         data: {
            labels: ["HTML", "CSS", "JAVASCRIPT", "CHART.JS", "JQUERY", "BOOTSTRP"],
            datasets: [{
                  type: 'scatter',
                  label: "online tutorial subjects",
                  data: [
                     {x:10, y:14},
                     {x:25, y:35},
                     {x:21, y:20},
                     {x:35, y:28},
                     {x:15, y:10},
                     {x:19, y:30}
                  ],
                  backgroundColor: ['yellow', 'aqua', 'pink', 'lightgreen', 'gold', 'lightblue'],
                  borderColor: ['black'],
                  radius: 8,
               },
               {
                  type: 'polarArea',
                  label: "online tutorial exam",
                  data: [20, 40, 30, 35, 30, 20],
                  backgroundColor: ['navy', 'aqua', 'pink', 'lightgreen', 'lightblue', 'gold'],
                  borderColor: ['black'],
                  borderWidth: 2,
                  pointRadius: 5,
               }
            ],
         },
         options: {
            responsive: false,
            scales: {
               y: {
                  beginAtZero: true
               }
            }
         },
      });
   </script>
</body>
</html>
Output

Advertisements