- Chart.js - Home
- Chart.js - Introduction
- Chart.js - Installation
- Chart.js - Syntax
- Chart.js - Basics
- Chart.js - Color
- Chart.js - Options
- Chart.js - Interactions
- Chart.js - Legend
- Chart.js - Title
- Chart.js - Animation
- Chart.js - Tooltip
- Chart.js - Line Chart
- Chart.js - Bar Chart
- Chart.js - Radar Chart
- Chart.js - Doughnut Chart
- Chart.js - Pie Chart
- Chart.js - Polar Area Chart
- Chart.js - Bubble Chart
- Chart.js - Scatter Chart
- Chart.js - Mixed Chart
- Chart.js - Cartesian Axis
- Chart.js - Category Axis
- Chart.js - Radial Axis
- Chart.js Useful Resources
- Chart.js - Quick Guide
- Chart.js - Useful Resources
- Chart.js - Discussion
Selected Reading
Chart.js - Title
Chart.js title defines which text is going to be seen at the top of our chart or graph. The namespace for Title configuration is options.plugins.title whereas the global option for the chart title is defined in Chart.defaults.plugins.title.
The table below gives the descriptions of various kinds of configuration options we can use with chart title −
| Name | Type | Default | Description |
|---|---|---|---|
| align | string | 'center' | As name implies, with this configuration you can set the alignment of the title. |
| color | Color | Chart.defaults.color | It will define the color of text. |
| display | Boolean | false | If true, it will show the title, else NOT. |
| fullSize | Boolean | true | As name implies, if true, the box will take the full width/height of the canvas. |
| position | string | 'top' | It is used to set the position of the title. The default is top position. |
| font | Font | {weight: 'bold'} | You can use various fonts. The options are in "Chart.defaults.font". |
| padding | Padding | 10 | It is use for padding to be applied around the title. |
| text | string|string[] | '' | As name implies, it is use for the title text to display. |
Syntax
The Chart Title syntax is given below −
title: {
   display: true,
   text: 'write heading here',
   color: 'navy',
   position: 'bottom',
}
The title enabled property must be true to display the data label. If it is set to false, then the title becomes deactivated.
Example
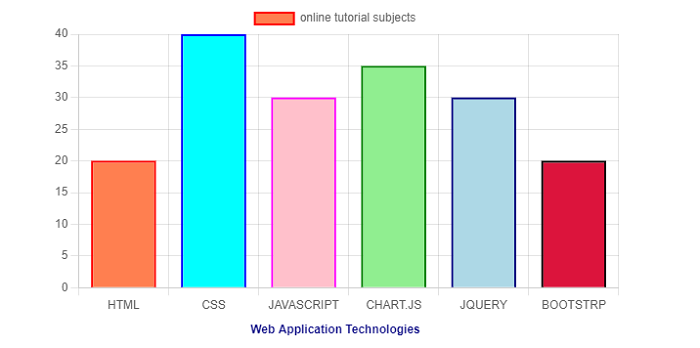
Lets take an example in which we will be using various Title configurations −
<!DOCTYPE>
<html>
<head>
   <meta charset- "UTF-8" />
   <meta name="viewport" content="width=device-width, initial-scale=1" />
   <title>chart.js</title>
</head>
<body>
   <canvas id="chartId" aria-label="chart" height="350" width="580"></canvas>
   <script src="https://cdnjs.cloudflare.com/ajax/libs/Chart.js/3.1.1/chart.min.js"></script>
   <script>
      var chrt = document.getElementById("chartId").getContext("2d");
      var chartId = new Chart(chrt, {
         type: 'bar',
         data: {
            labels: ["HTML", "CSS", "JAVASCRIPT", "CHART.JS", "JQUERY", "BOOTSTRP"],
            datasets: [{
               label: "online tutorial subjects",
               data: [20, 40, 30, 35, 30, 20],
               backgroundColor: ['coral', 'aqua', 'pink', 'lightgreen', 'lightblue', 'crimson'],
               borderColor: ['red', 'blue', 'fuchsia', 'green', 'navy', 'black'],
               borderWidth: 2,
            }],
         },
         options: {
            responsive: false,
            plugins: {
               title: {
                  display: true,
                  text: 'Web Application Technologies',
                  color: 'navy',
                  position: 'bottom',
                  align: 'center',
                  font: {
                     weight: 'bold'
                  },
                  padding: 8,
                  fullSize: true,
               }
            }
         },
      });
   </script>
</body>
</html>
Output
The following output chart shows the various Title configurations −

Advertisements