- Home
- Adjusted R-Squared
- Analysis of Variance
- Arithmetic Mean
- Arithmetic Median
- Arithmetic Mode
- Arithmetic Range
- Bar Graph
- Best Point Estimation
- Beta Distribution
- Binomial Distribution
- Black-Scholes model
- Boxplots
- Central limit theorem
- Chebyshev's Theorem
- Chi-squared Distribution
- Chi Squared table
- Circular Permutation
- Cluster sampling
- Cohen's kappa coefficient
- Combination
- Combination with replacement
- Comparing plots
- Continuous Uniform Distribution
- Continuous Series Arithmetic Mean
- Continuous Series Arithmetic Median
- Continuous Series Arithmetic Mode
- Cumulative Frequency
- Co-efficient of Variation
- Correlation Co-efficient
- Cumulative plots
- Cumulative Poisson Distribution
- Data collection
- Data collection - Questionaire Designing
- Data collection - Observation
- Data collection - Case Study Method
- Data Patterns
- Deciles Statistics
- Discrete Series Arithmetic Mean
- Discrete Series Arithmetic Median
- Discrete Series Arithmetic Mode
- Dot Plot
- Exponential distribution
- F distribution
- F Test Table
- Factorial
- Frequency Distribution
- Gamma Distribution
- Geometric Mean
- Geometric Probability Distribution
- Goodness of Fit
- Grand Mean
- Gumbel Distribution
- Harmonic Mean
- Harmonic Number
- Harmonic Resonance Frequency
- Histograms
- Hypergeometric Distribution
- Hypothesis testing
- Individual Series Arithmetic Mean
- Individual Series Arithmetic Median
- Individual Series Arithmetic Mode
- Interval Estimation
- Inverse Gamma Distribution
- Kolmogorov Smirnov Test
- Kurtosis
- Laplace Distribution
- Linear regression
- Log Gamma Distribution
- Logistic Regression
- Mcnemar Test
- Mean Deviation
- Means Difference
- Multinomial Distribution
- Negative Binomial Distribution
- Normal Distribution
- Odd and Even Permutation
- One Proportion Z Test
- Outlier Function
- Permutation
- Permutation with Replacement
- Pie Chart
- Poisson Distribution
- Pooled Variance (r)
- Power Calculator
- Probability
- Probability Additive Theorem
- Probability Multiplecative Theorem
- Probability Bayes Theorem
- Probability Density Function
- Process Capability (Cp) & Process Performance (Pp)
- Process Sigma
- Quadratic Regression Equation
- Qualitative Data Vs Quantitative Data
- Quartile Deviation
- Range Rule of Thumb
- Rayleigh Distribution
- Regression Intercept Confidence Interval
- Relative Standard Deviation
- Reliability Coefficient
- Required Sample Size
- Residual analysis
- Residual sum of squares
- Root Mean Square
- Sample planning
- Sampling methods
- Scatterplots
- Shannon Wiener Diversity Index
- Signal to Noise Ratio
- Simple random sampling
- Skewness
- Standard Deviation
- Standard Error ( SE )
- Standard normal table
- Statistical Significance
- Statistics Formulas
- Statistics Notation
- Stem and Leaf Plot
- Stratified sampling
- Student T Test
- Sum of Square
- T-Distribution Table
- Ti 83 Exponential Regression
- Transformations
- Trimmed Mean
- Type I & II Error
- Variance
- Venn Diagram
- Weak Law of Large Numbers
- Z table
- Statistics Useful Resources
- Statistics - Discussion
Statistics - Data Patterns
Data patterns are very useful when they are drawn graphically. Data patterns commonly described in terms of features like center, spread, shape, and other unusual properties. Other special descriptive labels are symmetric, bell-shaped, skewed, etc.
Center
The center of a distribution, graphically, is located at the median of the distribution. Such a graphic chart displays that almost half of the observations are on either side. Height of each column indicates the frequency of observations.
Spread
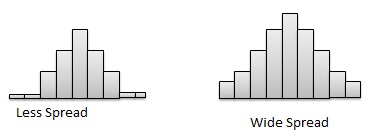
The spread of a distribution refers to the variation of the data. If the set of observation covers a wide range, the spread is larger. If the observations are centered around a single value, then the spread is smaller.
Shape
The shape of a distribution can described using following characteristics.
Symmetry - In symmetric distribution, graph can be divided at the center in such a way that each half is a mirror image of the other.
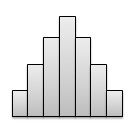
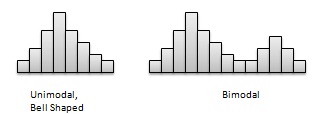
Number of peaks. - Distributions with one or multiple peaks. Distribution with one clear peak is known as unimodal, and distribution with two clear peaks is called bimodal. A single peak symmetric distribution at the center, is referred to as bell-shaped.
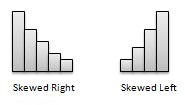
Skewness - Some distributions may have multiple observations on one side of the graph than the other side. Distributions having fewer observations towards lower values are said to be skewed right; and distributions with fewer observations towards lower values are said to be skewed left.
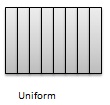
Uniform - When the set of observations has no peak and have data equally spread across the range of the distribution, then the distribution is called a uniform distribution.
Unusual Features
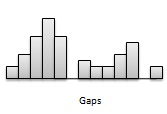
Common unusual features of data patterns are gaps and outliers.
Gaps - Gaps points to areas of a distribution having no observations. Following figure has a gap as there are no observations in the middle of the distribution.
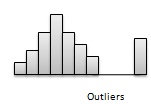
Outliers - Distributions may be characterized by extreme values that differ greatly from the other set of observation data. These extreme values are refered as outliers. Following figure illustrates a distribution with an outlier.