- SAP Lumira - Home
- SAP Lumira - Overview
- SAP Lumira - Data Sources
- SAP Lumira - Data Acquisition
- SAP Lumira - Editing Acquired Data
- SAP Lumira - Viewing Connections
- SAP Lumira - Working with Excel Files
- SAP Lumira - Working with CSV Files
- SAP Lumira - Connecting HANA Views
- SAP Lumira - Download from HANA
- SAP Lumira - Universe as a Data Src
- SAP Lumira - Using Query with SQL
- SAP Lumira - Working Modes
- SAP Lumira - Prepare Phase
- SAP Lumira - Visualize Phase
- SAP Lumira - Compose Phase
- SAP Lumira - Share Phase
- SAP Lumira - New Document
- SAP Lumira - Creating Charts
- SAP Lumira - Chart Types
- SAP Lumira - Conditional Formatting
- SAP Lumira - Preparing Data in Tab
- SAP Lumira - Editing Data
- SAP Lumira - Numbers & Dates
- SAP Lumira - Enriching Data
- SAP Lumira - Working with Datasets
- SAP Lumira - Visualizing Data
- SAP Lumira - Legend Colors
- SAP Lumira - Creating Stories
- SAP Lumira - Slideshows
- SAP Lumira - Customizing Stories
- Lumira - Charts, Stories & Datasets
- SAP Lumira - Publishing Datasets
- SAP Lumira - Questions Answers
- SAP Lumira - Quick Guide
- SAP Lumira - Useful Resources
- SAP Lumira - Discussion
SAP Lumira - Working With Excel Files
You can use an Excel file to create data set in SAP Lumira.
Follow the steps given below.
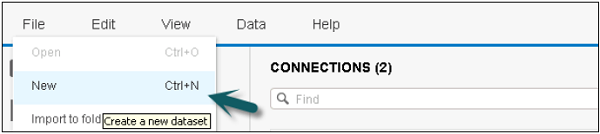
Step 1 − Go to File → New (Create a data set).
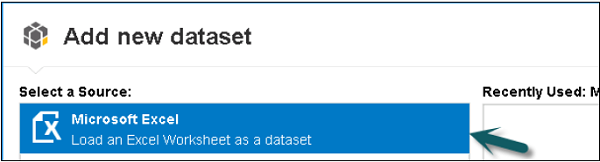
Step 2 − Select a Source − Load an Excel worksheet as a dataset and click the Next icon at the bottom.
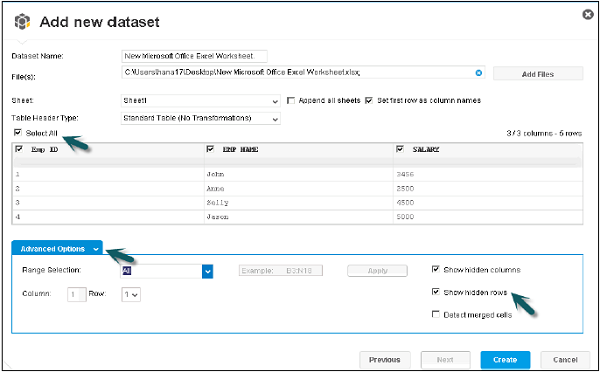
Step 3 − Browse the path of .xls file. You have an option to choose the first row as column names. You can hide a particular column from .xls by selecting the Select All option.
Step 4 − You can click the Advance option to select a custom range. You can also include hidden rows and columns. Once correct options are selected, click the create button at the bottom.
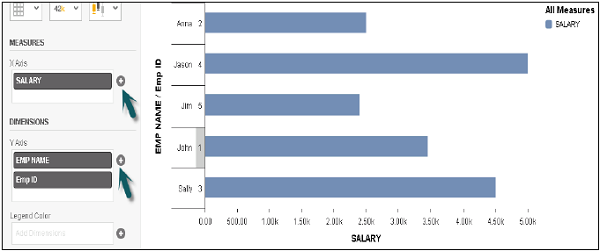
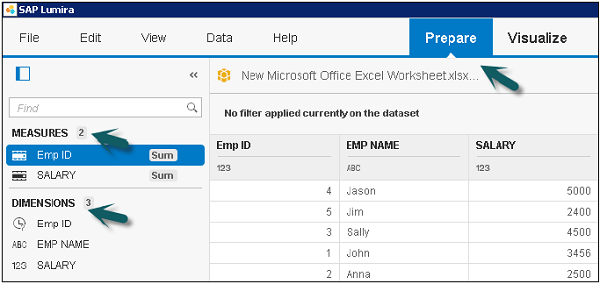
Step 5 − All the data with integer values appear under Measures and all the columns appear under Dimensions. This data will come under the Prepare tab.
Step 6 − Go to the Visualize tab at the top to create the visualization on top of the data set.