- SAP Lumira - Home
- SAP Lumira - Overview
- SAP Lumira - Data Sources
- SAP Lumira - Data Acquisition
- SAP Lumira - Editing Acquired Data
- SAP Lumira - Viewing Connections
- SAP Lumira - Working with Excel Files
- SAP Lumira - Working with CSV Files
- SAP Lumira - Connecting HANA Views
- SAP Lumira - Download from HANA
- SAP Lumira - Universe as a Data Src
- SAP Lumira - Using Query with SQL
- SAP Lumira - Working Modes
- SAP Lumira - Prepare Phase
- SAP Lumira - Visualize Phase
- SAP Lumira - Compose Phase
- SAP Lumira - Share Phase
- SAP Lumira - New Document
- SAP Lumira - Creating Charts
- SAP Lumira - Chart Types
- SAP Lumira - Conditional Formatting
- SAP Lumira - Preparing Data in Tab
- SAP Lumira - Editing Data
- SAP Lumira - Numbers & Dates
- SAP Lumira - Enriching Data
- SAP Lumira - Working with Datasets
- SAP Lumira - Visualizing Data
- SAP Lumira - Legend Colors
- SAP Lumira - Creating Stories
- SAP Lumira - Slideshows
- SAP Lumira - Customizing Stories
- Lumira - Charts, Stories & Datasets
- SAP Lumira - Publishing Datasets
- SAP Lumira - Questions Answers
- SAP Lumira - Quick Guide
- SAP Lumira - Useful Resources
- SAP Lumira - Discussion
SAP Lumira - Enriching Data
Creating Hierarchies
This option can be used if the acquired dataset contains data that can be converted to hierarchies like Time hierarchy or Region hierarchy.
Hierarchies are used to display data at different granularity level and you can drill up/down at different levels for better understanding of relationship between objects.
Creating a Geography hierarchy
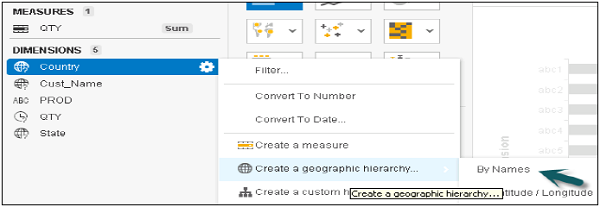
When the data is acquired, the application looks for dimension containing location and present with an icon.
Step 1 − Click the icon in front of a dimension. From the available options, select Create a Geographic hierarchy → By Names (this option is available only for string dimensions).
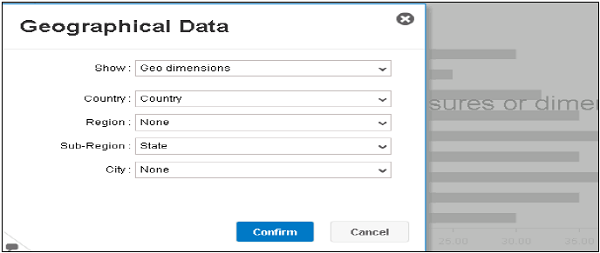
Step 2 − A new window will open with the name Geographical data → select the dimension to map to hierarchy. Click Confirm.
Example −
| Country | Cust_Name | QTY | PROD | State |
|---|---|---|---|---|
| India | Jack | 1 | Phone | Haryana |
| England | Jone | 3 | Tab | Durham |
| India | Andy | 5 | Phone | Punjab |
| India | Ana | 2 | Watch | Chennai |
| England | Tim | 6 | Tab | Kent |
Step 3 − If Region does not apply to the dataset, select None from the list.
Step 4 − It will show you, a list of all the analyzed values, Solved and Not Found. For all the solved values, it will create a hierarchy. Click Done.
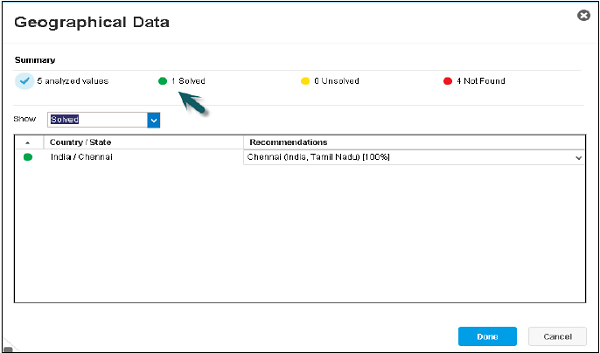
You will observe the following −
Locations mapped exactly are marked with green.
Locations with more than one possible match (for example, if more than one city named London was found) are marked with yellow.
Locations not found in the geographic database are marked with Red.
Hierarchy will be added under Geographical data.
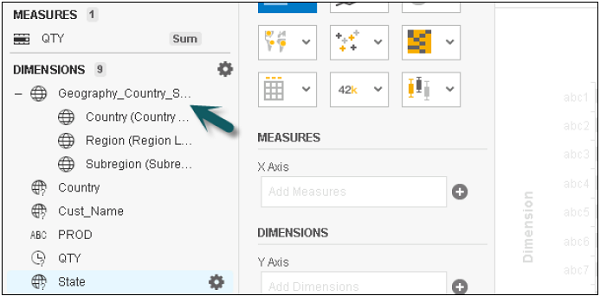
Step 5 − To use this chart, select any Geo chart like Geo Bubble chart.
Step 6 − Add Country to Geography and Measure to the chart. Select the value in the chart and you will get a drill option to the next level.
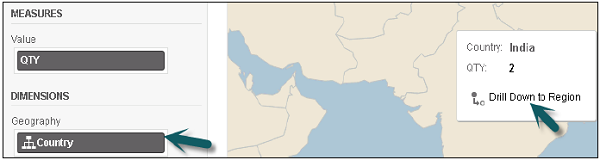
Step7 − If you click the Drill option, you will go to the next level and so on.
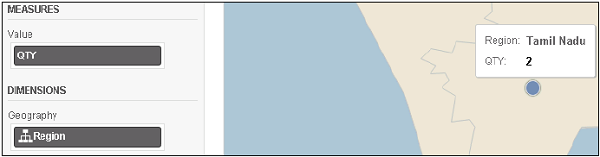
In a similar way, you can apply Time hierarchy.
Creating a Custom Hierarchy
You can create hierarchies using any available combination of dimensions in acquired dataset.
Example
Category → Product Line → Product
| Country | Cust_Name | QTY | PROD | PROD Category |
|---|---|---|---|---|
| India | Jack | 1 | Samsung Note 4 | Phone |
| England | Jone | 3 | XOLOQC800 | Tab |
| India | Andy | 5 | Apple6s | Phone |
| India | Ana | 2 | Titan | Watch |
| England | Tim | 6 | Lenovo A1000 | Tab |
Follow the steps given below −
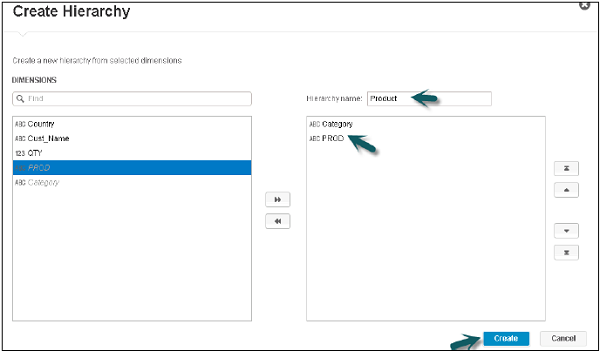
Step 1 − Select Category → Options → Create a Custom hierarchy
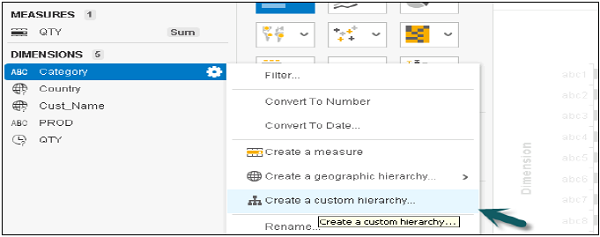
Step 2 − A new window will open. Enter the name of the hierarchy and select the other dimensions to add to the next levels. Click Create. The arrows can be used to change the level.
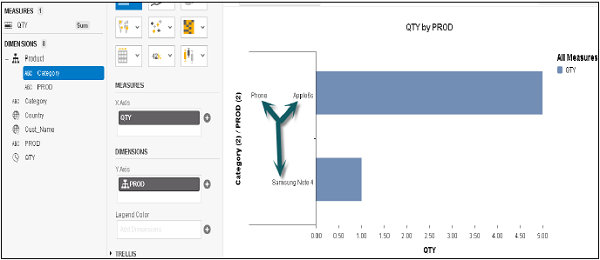
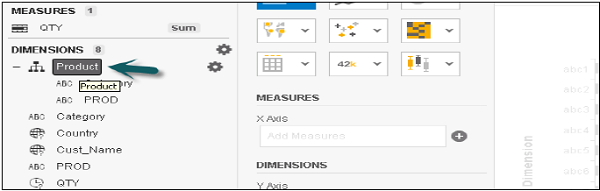
Step 3 − The Product hierarchy will be added under the Dimensions tab.
Step 4 − Add a Bar chart and then Add Category and QTY to measures.
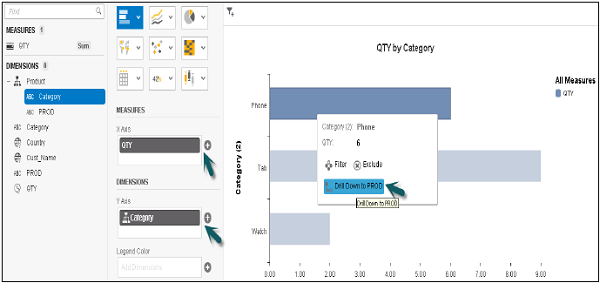
Once you click the Category option, you will get an option to drill down to the next level (PROD).