
- SAP Lumira - Home
- SAP Lumira - Overview
- SAP Lumira - Data Sources
- SAP Lumira - Data Acquisition
- SAP Lumira - Editing Acquired Data
- SAP Lumira - Viewing Connections
- SAP Lumira - Working with Excel Files
- SAP Lumira - Working with CSV Files
- SAP Lumira - Connecting HANA Views
- SAP Lumira - Download from HANA
- SAP Lumira - Universe as a Data Src
- SAP Lumira - Using Query with SQL
- SAP Lumira - Working Modes
- SAP Lumira - Prepare Phase
- SAP Lumira - Visualize Phase
- SAP Lumira - Compose Phase
- SAP Lumira - Share Phase
- SAP Lumira - New Document
- SAP Lumira - Creating Charts
- SAP Lumira - Chart Types
- SAP Lumira - Conditional Formatting
- SAP Lumira - Preparing Data in Tab
- SAP Lumira - Editing Data
- SAP Lumira - Numbers & Dates
- SAP Lumira - Enriching Data
- SAP Lumira - Working with Datasets
- SAP Lumira - Visualizing Data
- SAP Lumira - Legend Colors
- SAP Lumira - Creating Stories
- SAP Lumira - Slideshows
- SAP Lumira - Customizing Stories
- Lumira - Charts, Stories & Datasets
- SAP Lumira - Publishing Datasets
- SAP Lumira - Questions Answers
- SAP Lumira - Quick Guide
- SAP Lumira - Useful Resources
- SAP Lumira - Discussion
SAP Lumira - Conditional Formatting
It is used to mention the critical data points in a chart by different values meeting certain condition. Multiple conditional formatting rules can be applied on measures or dimensions.
Conditional formatting can be applied on −
- Bar and Column charts (except 3D column charts)
- Pie chart
- Donut chart
- Scatter chart
- Bubble chart
- Cross tab
Creating a Conditional Formatting Rule
To define a conditional formatting in a chart, it should have a measure value added to it.
The procedure is given below.
Click the new Conditional formatting icon. It will open the rule editor box. Enter the name of rule editor.
Select Based on list to add a measure or a dimension. You can set multiple conditional formatting rules on a single measure or dimension.
The next step is to select an operator and add one or more values for condition.
Saving Charts
You can save a chart by clicking the Settings button. The available options are displayed.
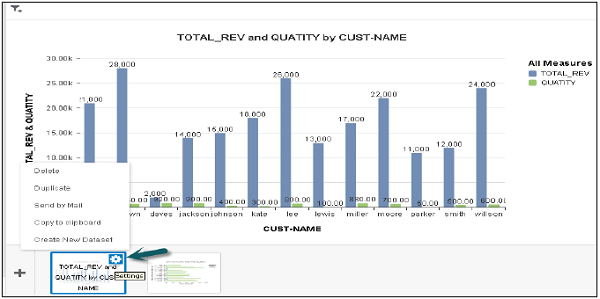
The various options available are −
- Copy to Clipboard
- Send by Mail
- Duplicate
Copy to Clipboard − You can use the copy to clipboard option. Select the Export size and click OK.
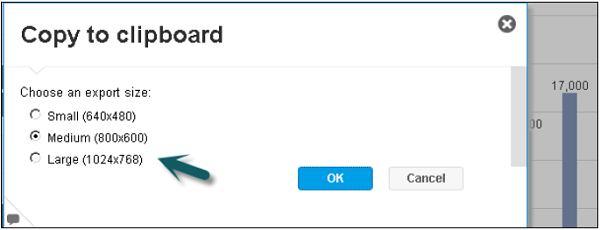
You can paste this chart in any Document file, Paint, etc.
Send by mail − Select an Export size → OK. It will attach the chart in the mail and you have to enter the recipient email id.
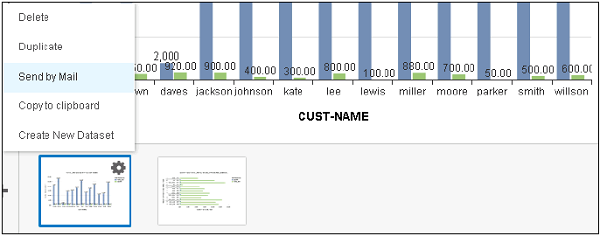
Duplicate option will create a copy of the chart in same Visualization tab.
