- SAP Lumira - Home
- SAP Lumira - Overview
- SAP Lumira - Data Sources
- SAP Lumira - Data Acquisition
- SAP Lumira - Editing Acquired Data
- SAP Lumira - Viewing Connections
- SAP Lumira - Working with Excel Files
- SAP Lumira - Working with CSV Files
- SAP Lumira - Connecting HANA Views
- SAP Lumira - Download from HANA
- SAP Lumira - Universe as a Data Src
- SAP Lumira - Using Query with SQL
- SAP Lumira - Working Modes
- SAP Lumira - Prepare Phase
- SAP Lumira - Visualize Phase
- SAP Lumira - Compose Phase
- SAP Lumira - Share Phase
- SAP Lumira - New Document
- SAP Lumira - Creating Charts
- SAP Lumira - Chart Types
- SAP Lumira - Conditional Formatting
- SAP Lumira - Preparing Data in Tab
- SAP Lumira - Editing Data
- SAP Lumira - Numbers & Dates
- SAP Lumira - Enriching Data
- SAP Lumira - Working with Datasets
- SAP Lumira - Visualizing Data
- SAP Lumira - Legend Colors
- SAP Lumira - Creating Stories
- SAP Lumira - Slideshows
- SAP Lumira - Customizing Stories
- Lumira - Charts, Stories & Datasets
- SAP Lumira - Publishing Datasets
- SAP Lumira - Questions Answers
- SAP Lumira - Quick Guide
- SAP Lumira - Useful Resources
- SAP Lumira - Discussion
SAP Lumira - Creating Stories
You can create different stories in SAP Lumira in presentation-style document using visualization, graphics and other customizations that have been applied to the dataset.
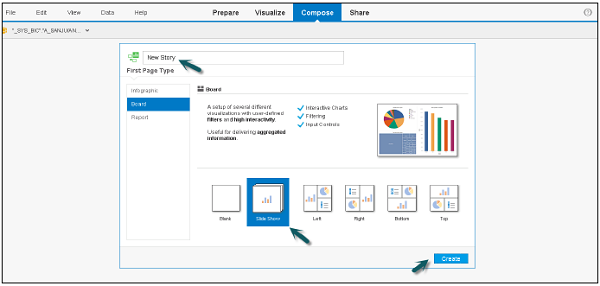
You have to customize the compose tab once and you get multiple options to select an Infographic, Board or a Report.
Enter the name of the Story and click Create. You have different panels in Compose tab as shown in the screenshot.
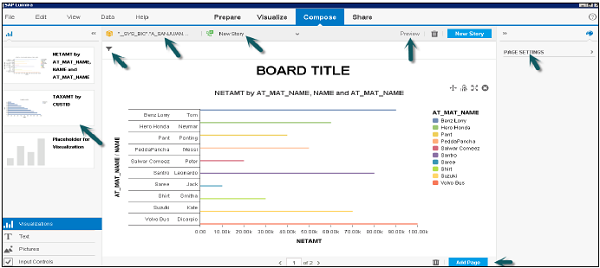
Content Panel
The left panel contains different types of content that you can add to the story page. You can select any item and drag it to a section on the story page.
- Dataset Selector
- Story Selector
- Preview
- Filter Bar
- Add Page and Delete Page
- Page Settings, Etc.
Creating Stories with Charts and Data
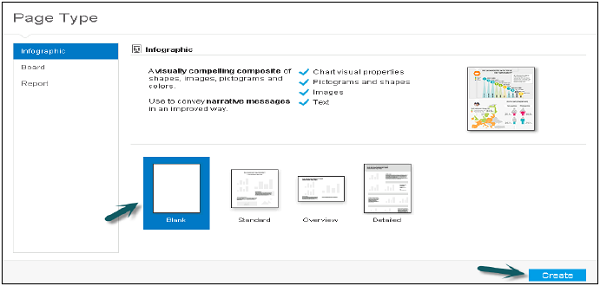
Step 1 − To create stories using chart, go to Compose and select a Blank Infographic. Click the Create button as shown in the screenshot below.
In the left panel, you will get options to add Visualizations, Text, pictures, pictograms, etc.
Step 2 − To add multiple visualizations in a story, just click on the + sign at the bottom pane.
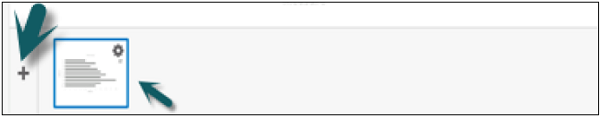
Step 3 − Drag a chart you want to add, to the story.
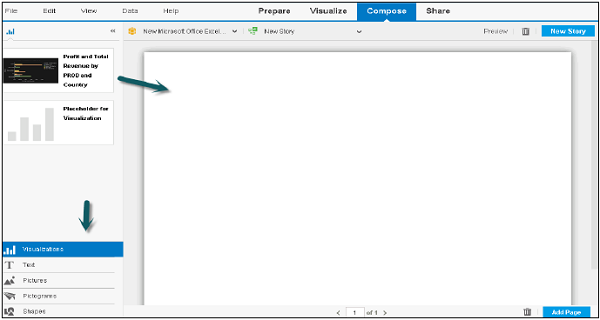
Step 4 − Suppose you want to add two charts in your Lumira story. One by the Customer and other by the product. Drag one chart to Story area.
Step 5 − You can also do page settings, Back ground color, etc.
Step 6 − To add another chart, go back to the Visualize tab and make changes to the Chart Dimension and measure panel.
Step 7 − Go to Compose tab and select the next chart to be added. All Visualizations in Visualize tab will be shown under the left panel. You can create multiple visualizations to create stories.
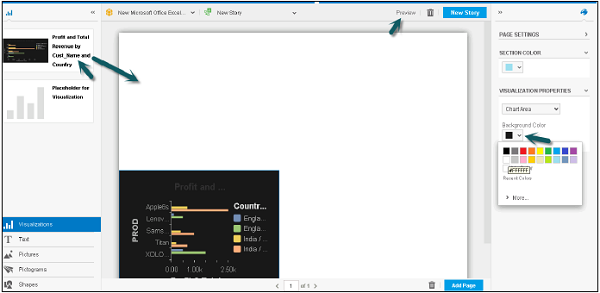
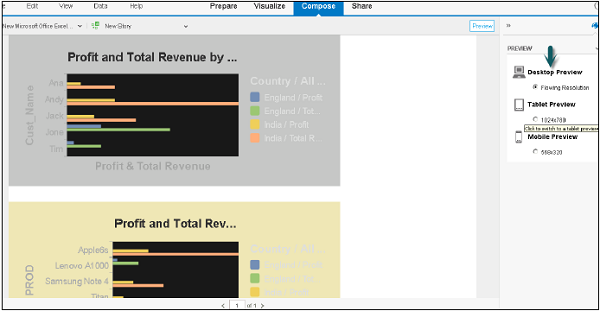
Step 8 − At the top, you have an option to preview the story in desktop preview, tablet preview and mobile device. Click the Preview icon. To go back, click the Preview icon again.