- SAP Lumira - Home
- SAP Lumira - Overview
- SAP Lumira - Data Sources
- SAP Lumira - Data Acquisition
- SAP Lumira - Editing Acquired Data
- SAP Lumira - Viewing Connections
- SAP Lumira - Working with Excel Files
- SAP Lumira - Working with CSV Files
- SAP Lumira - Connecting HANA Views
- SAP Lumira - Download from HANA
- SAP Lumira - Universe as a Data Src
- SAP Lumira - Using Query with SQL
- SAP Lumira - Working Modes
- SAP Lumira - Prepare Phase
- SAP Lumira - Visualize Phase
- SAP Lumira - Compose Phase
- SAP Lumira - Share Phase
- SAP Lumira - New Document
- SAP Lumira - Creating Charts
- SAP Lumira - Chart Types
- SAP Lumira - Conditional Formatting
- SAP Lumira - Preparing Data in Tab
- SAP Lumira - Editing Data
- SAP Lumira - Numbers & Dates
- SAP Lumira - Enriching Data
- SAP Lumira - Working with Datasets
- SAP Lumira - Visualizing Data
- SAP Lumira - Legend Colors
- SAP Lumira - Creating Stories
- SAP Lumira - Slideshows
- SAP Lumira - Customizing Stories
- Lumira - Charts, Stories & Datasets
- SAP Lumira - Publishing Datasets
- SAP Lumira - Questions Answers
- SAP Lumira - Quick Guide
- SAP Lumira - Useful Resources
- SAP Lumira - Discussion
SAP Lumira - Creating Charts
In SAP Lumira, a chart can be created by dragging measures and dimensions to the Chart Canvas in the central area under the Visualize tab.
To create a chart, there should be at least one measure. When a dimension is added to the chart, it shows values based on the measures.
Adding a chart in Chart builder
Follow the steps to add a chart.
Step 1 − In the Visualize tab, go to Chart Builder.
Step 2 − Select a chart type that you want to use in the Chart Builder. Bar Chart is the default chart type, but you can select any chart from the list.
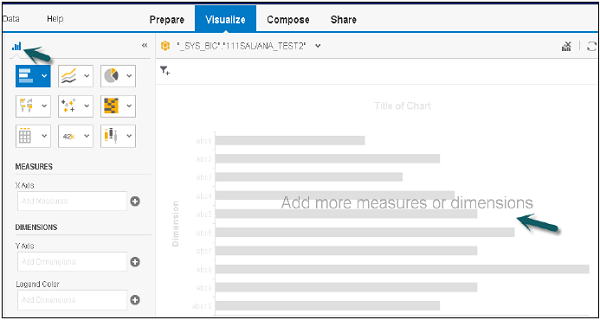
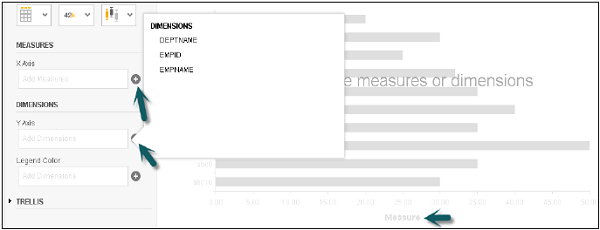
Step 3 − The next step is to choose a measure and drag it to an axis on the Chart Canvas. You can check in chart where to add dimensions and measures.
Step 4 − You can click on + sign to add a dimension or measure to a chart.
Step 5 − Select a dimension and drag it to the Chart Canvas. The text in the chart body guides you to the correct axis for the dimension.
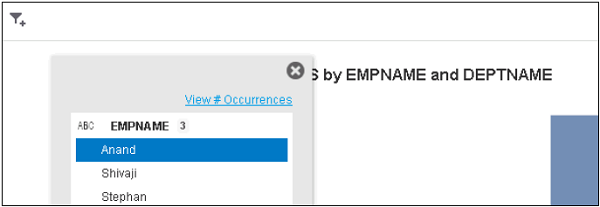
Step 6 − You can also add a filter to chart by clicking on filter option at the top.
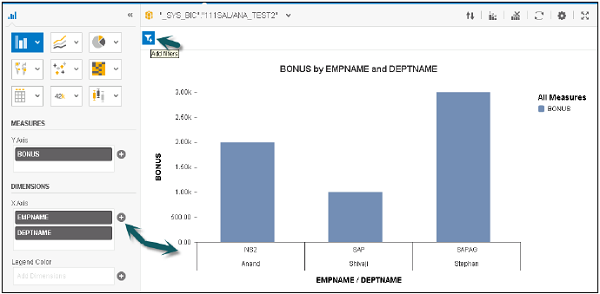
Step 7 − Select the dimension on which you want to apply a filter and click OK.