- Home
- Introduction
- Reporting and Dashboard Tools
- Different BO Tools Connection to HANA
- Creating a Relational Connection
- Creating an OLAP Connection
- HANA Modeling Views
- Input Parameters in HANA
- Using Attribute View
- Using Analytic View
- Using Calculation View
- Using Tables in HANA DB
- Connecting Webi to HANA
- Universe Development
- User Prompts and Filter in IDT
- Webi Report Development
- Lumira Connection to HANA
- Dashboard Development in Lumira
- Dashboard Designer Connection to HANA
- Dashboard Development in DD
- Connecting Crystal to HANA Views
- Crystal Report Development on HANA
- BW on HANA Connection
- Design Studio Connection with HANA
- Development in Design Studio
- Publishing BI Reports on HANA
- Benefits of Using HANA
- Connecting HANA with Other BI Tools
- Interview Questions
Using Analytic View
Analytic View is in the form of Star schema, wherein we join one Fact table to multiple Dimension tables. Analytic views use real power of SAP HANA to perform complex calculations and aggregate functions by joining tables in the form of Star schema and by executing Star schema queries.
Following are the key characteristics of SAP HANA Analytic View −
Analytic Views are used to perform complex calculations and Aggregate functions such as Sum, Count, Min, Max, etc.
Analytic Views are designed to run Star schema queries.
Each Analytic View has one Fact table surrounded by multiple dimension tables. Fact table contains a primary key for each Dim table and measures.
Analytic Views are similar to Info Objects and Info sets of SAP BW.
SAP BusinessObjects reporting tools can connect to Analytic view using an OLAP connection for reporting and dashboard.
How to Create an Analytic View?
In SAP HANA, you can create an Analytic view to implement Star Schema queries. All these objects are created inside a Package and published to HANA Repository.
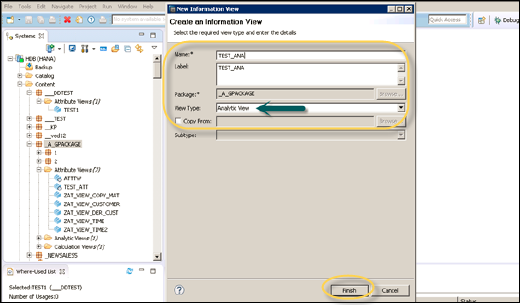
To create a new Analytic view, select the Package name under which you want to create it. Right-click the Package → Go to New Tab → Analytic View. When you click an Analytic View, a new window will open. Enter the View name and Description and from the dropdown list and choose the View Type and finally click Finish.
When you click Finish, you can see an Analytic View with Data Foundation and Star Join option. To add tables to the Analytic view, click the Data Foundation to add Dimension and Fact tables. Click the Star Join to add Attribute Views.
Add Dim and Fact tables to Data Foundation using "+" sign. In the following example, we have added 3 dim tables to Data Foundation: DIM_CUSTOMER, DIM_PRODUCT, DIM_REGION and 1 Fact table FCT_SALES to the Details Pane. A Join is applied to connect Dim tables to the Fact table using Primary Keys stored in the Fact table.
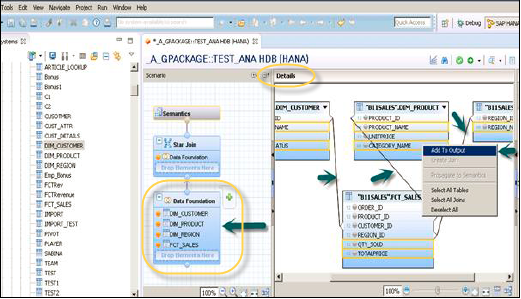
Select Attributes from Dim and Fact table to add to the Output pane as shown in the following screenshot. Change the data type of Facts, from the fact table to measures.
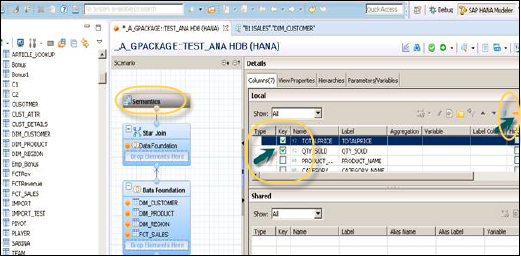
Navigate to the Semantic layer, select dimension and measures and click the data type if it is not picked by default. You can also use Auto-detection. Next, activate the View.
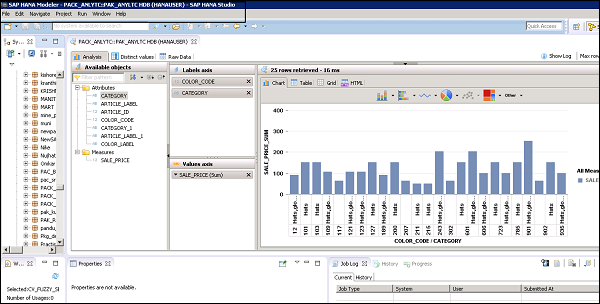
To activate the view, click the Arrow mark at the top (F8) button. Once you activate the view and click Data Preview, all attributes and measures will be added under the list of Available objects. Add Attributes to Labels Axis and Measure to Value axis for analysis purpose.