- Home
- Introduction
- Reporting and Dashboard Tools
- Different BO Tools Connection to HANA
- Creating a Relational Connection
- Creating an OLAP Connection
- HANA Modeling Views
- Input Parameters in HANA
- Using Attribute View
- Using Analytic View
- Using Calculation View
- Using Tables in HANA DB
- Connecting Webi to HANA
- Universe Development
- User Prompts and Filter in IDT
- Webi Report Development
- Lumira Connection to HANA
- Dashboard Development in Lumira
- Dashboard Designer Connection to HANA
- Dashboard Development in DD
- Connecting Crystal to HANA Views
- Crystal Report Development on HANA
- BW on HANA Connection
- Design Studio Connection with HANA
- Development in Design Studio
- Publishing BI Reports on HANA
- Benefits of Using HANA
- Connecting HANA with Other BI Tools
- Interview Questions
HANA Modeling Views
SAP HANA Modeling is one of the key capabilities of HANA system. This allows to create multidimensional objects on top of HANA database objects to meet the business requirements for reporting. You can implement complex business logic using HANA information models to create a meaningful report for analysis.
Features of HANA Modeling
SAP HANA Modeling is one of the key concepts in HANA BI reporting.
Using HANA Modeling, you can create complex data models as per business requirement to provide multiple views of transactional data stored in physical tables of HANA database.
SAP HANA Modeling can only be done for column-based storage tables.
HANA Modeling views can be used directly by SAP BusinessObjects reporting tools such as Crystal Reports or Lumira using an OALP or HTTP connection.
HANA supports different types of Modeling views such as - Attribute view is used to model characteristics, Analytic view is used to implement Star schema and Calculation view is used to implement complex logics, which are not possible with other type of views (Galaxy schema).
SAP HANA Modeling views can also be directly connected to third party tools such as MS Excel using HANA MDX Provider.
SAP HANA Modeling supports various features of Business Layer - Creating new calculated columns, new measures, input parameters, hierarchies, etc.
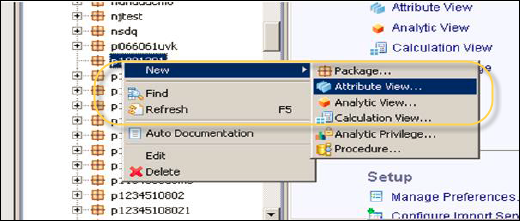
SAP HANA provides following three types of Information Views −
- Attribute View
- Analytic View
- Calculation View
All HANA Modeling objects are stored in HANA Repository and it can be directly accessed using any BI tool via proper authentication. When these objects are imported in any of the reporting tools using an OLAP or HTTP connection, it also imports all the custom properties of that model.
SAP HANA suite also offers basic BI reporting functionalities, where you can create interactive charts using data in HANA models.
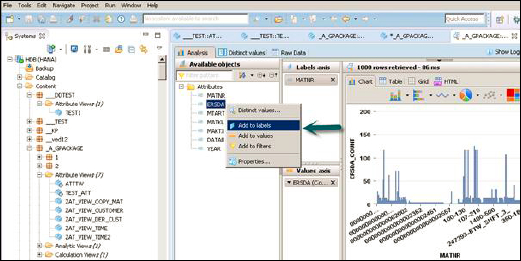
Like other BI reporting tools, you can add dimension and measure values to Label and Value axis. HANA provides the following options for BI analysis −
Analysis − This tab is used to add different dimension and measure values to different label axis. Filters can be applied as per business requirement.
Distinct Values − This tab is used to see distinct values in data analysis for each of dimension.
Raw Data − This tab shows all raw data coming from data model as per Business Layer parameters.
In a BI report, you can select from the following options: Chart, Table, Grid, or HTML.
