
Article Categories
- All Categories
-
 Data Structure
-
 Networking
-
 RDBMS
RDBMS
-
 Operating System
-
 Java
Java
-
 MS Excel
-
 iOS
iOS
-
 HTML
HTML
-
 CSS
CSS
-
 Android
-
 Python
-
 C Programming
-
 C++
C++
-
 C#
C#
-
 MongoDB
-
 MySQL
MySQL
-
 Javascript
-
 PHP
PHP
-
 Economics & Finance
Selected Reading
How to set the position of legend of a ggplot2 graph to left-top side in R?
To set the position of legend of a ggplot2 graph to left-top side in R, we can follow the below steps −
- First of all, create a data frame.
- Then, create a plot using ggplot2 with legend.
- After that, add theme function to the ggplot2 graph to change the position of legend.
Create the data frame
Let's create a data frame as shown below −
> x<-rnorm(20)
> y<-rnorm(20)
> Grp<-sample(LETTERS[1:3],20,replace=TRUE)
> df<-data.frame(x,y,Grp)
> df
On executing, the above script generates the below output(this output will vary on your system due to randomization) −
          x          y     Grp
1   1.534536456  1.16096642 B
2   1.567893173 -0.17938243 C
3   0.219385319  2.62085316 C
4  -0.938538786 -0.94876509 B
5   0.832347518 -0.09606333 A
6  -0.911782027  0.50632929 C
7   1.354217337  2.47764220 C
8  -0.617858224  2.30016380 B
9  -1.737989082  0.92724144 C
10 -0.259531545 -0.57381245 C
11 -1.918066704  0.09229845 C
12  1.629362782 -0.51709805 A
13 -1.883654954 -0.83957574 B
14 -1.332048207 -0.71536625 A
15  0.557178620  0.69712337 A
16  0.792400357  1.45278937 A
17 -0.663704303  1.53909912 C
18 -0.001937304  0.77318715 C
19  0.988360833  0.57546402 B
20 -1.146529863 -0.50335310 A
Create a plot using ggplot2
Example
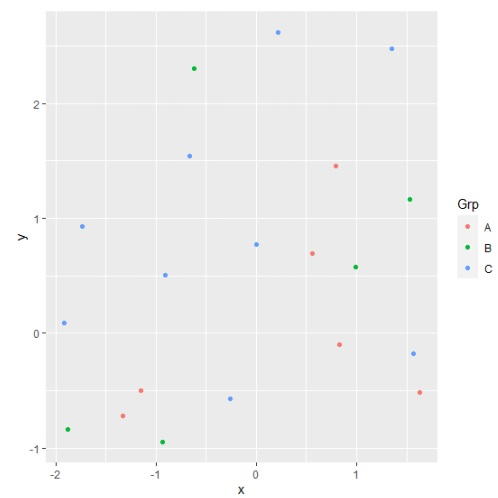
Loading ggplot2 package and creating point chart between x and y with legend values based on Grp column −
> x<-rnorm(20)
> y<-rnorm(20)
> Grp<-sample(LETTERS[1:3],20,replace=TRUE)
> df<-data.frame(x,y,Grp)
> library(ggplot2)
> ggplot(df,aes(x,y,colour=Grp))+geom_point()
Output
Create the plot with legend position on left-top side
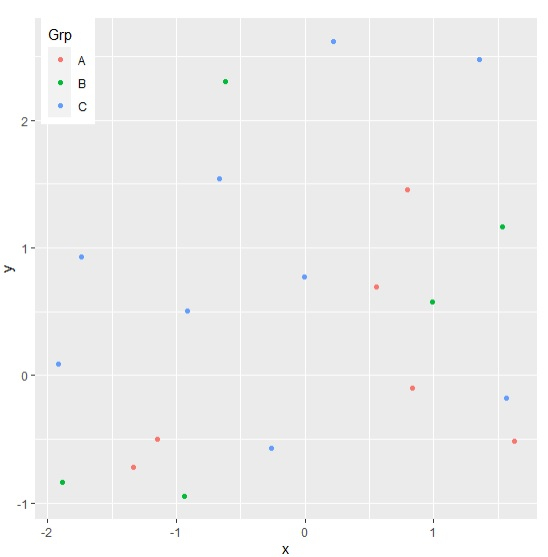
Using theme function to set the position of legend on left-top side inside the plot −
> x<-rnorm(20)
> y<-rnorm(20)
> Grp<-sample(LETTERS[1:3],20,replace=TRUE)
> df<-data.frame(x,y,Grp)
> library(ggplot2)
>
ggplot(df,aes(x,y,colour=Grp))+geom_point()+theme(legend.justification=c(9.2,1),legen
d.position=c(1,1))
Output

Updated on: 2026-03-11T22:50:57+05:30
753 Views

Advertisements