
Article Categories
- All Categories
-
 Data Structure
-
 Networking
-
 RDBMS
RDBMS
-
 Operating System
-
 Java
Java
-
 MS Excel
-
 iOS
iOS
-
 HTML
HTML
-
 CSS
CSS
-
 Android
-
 Python
-
 C Programming
-
 C++
C++
-
 C#
C#
-
 MongoDB
-
 MySQL
MySQL
-
 Javascript
-
 PHP
PHP
-
 Economics & Finance
How to rotate a ggplot2 graph in R?
To rotate a ggplot2 graph, we can save it in an object and then use the print function by defining the angle with viewport.
For example, if we have a graph saved in an object called PLOT then we can rotate it to 180 degrees by using the below mentioned command −
print(PLOT,vp=viewport(angle=180))
Example
Following snippet creates a sample data frame −
x<-rnorm(20)
y<-rnorm(20)
df<-data.frame(x,y)
df
The following dataframe is created −
       x            y
1   0.096637307  -0.79663988
2  -0.972807954   0.09542357
3  -0.598539638  -0.40307342
4   0.313019069  -1.71758236
5   0.008732982  -0.04097218
6  -1.967420198  -0.91776162
7   1.736633544  -1.00466672
8  -1.286458206   0.83934337
9   1.742263463   1.77801623
10 -1.392702332   0.42326171
11  1.372442801  -0.44339030
12  0.644544774  -0.43074140
13 -0.709155189  -0.16955879
14 -0.590529608  -0.11673118
15  0.289056603  -0.37740204
16  0.007818706   0.43813133
17 -1.433209373  -1.34470356
18 -1.725729337   3.89311303
19  0.875404110   1.06213466
20 -0.020995825   0.12973470
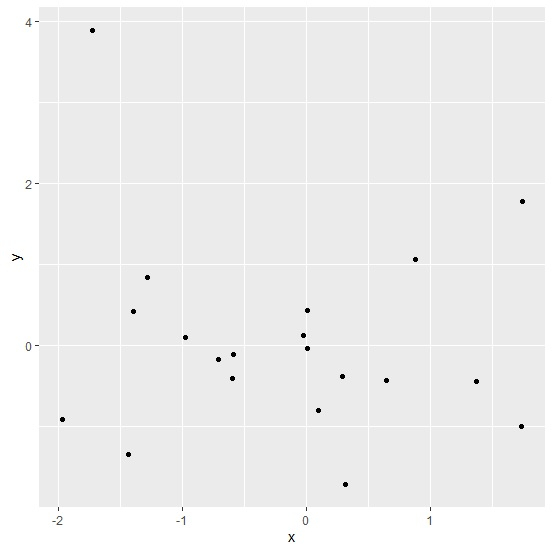
In order to load ggplot2 package and create point chart between x and y, add the following code to the above snippet −
library(ggplot2)
Plot<-ggplot(df,aes(x,y))+geom_point()
Plot
Output
If you execute all the above given snippets as a single program, it generates the following output −
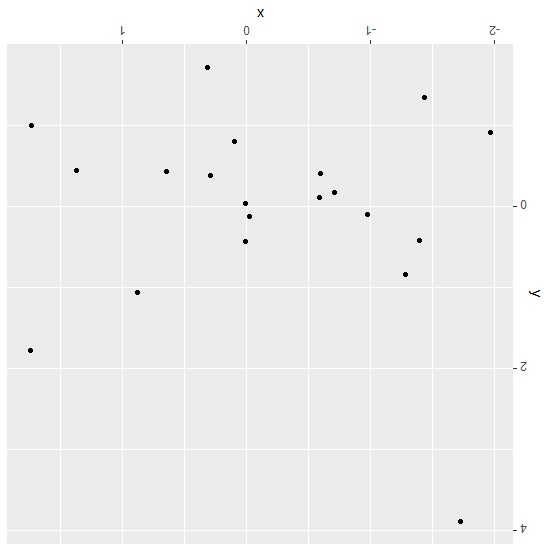
In order to rotate the above plot to 180 degrees, add the following code to the above snippet −
print(Plot,vp=viewport(angle=180))
Output
If you execute all the above given snippets as a single program, it generates the following output −

1K+ Views
