
Article Categories
- All Categories
-
 Data Structure
-
 Networking
-
 RDBMS
RDBMS
-
 Operating System
-
 Java
Java
-
 MS Excel
-
 iOS
iOS
-
 HTML
HTML
-
 CSS
CSS
-
 Android
-
 Python
-
 C Programming
-
 C++
C++
-
 C#
C#
-
 MongoDB
-
 MySQL
MySQL
-
 Javascript
-
 PHP
PHP
-
 Economics & Finance
Selected Reading
How to change the legend shape using ggplot2 in R?
By default, the shape of legend is circular but we can change it by using the guides function of ggplot2 package. For example, if we have a data frame with two numerical columns say x and y, and one categorical column Group then the scatterplot between x and y for different color values of categories in categorical column Group having different shape of legends can be created by using the below command −
ggplot(df,aes(x,y,color=Group))+geom_point()+guides(colour=guide_legend(override.aes=list(shape=0)))
Here, we can change the shape argument value to any value between starting from 0 to 25.
Consider the below data frame −
Example
x<-rpois(20,5)
y<-rpois(20,2)
Group<-sample(c("Male","Female"),20,replace=TRUE)
df<-data.frame(x,y,Group)
df
Output
   x  y  Group
1  7  1  Female
2  7  0  Female
3  4  2  Male
4  3  2  Male
5  2  1  Male
6  9  0  Female
7  5  4  Male
8  3  1  Female
9  5  1  Female
10 6  1  Female
11 3  2  Male
12 5  1  Male
13 4  1  Male
14 5  3  Female
15 1  6  Female
16 5  3  Male
17 4  2  Female
18  5 5  Female
19 2  3  Female
20 5  4  Male
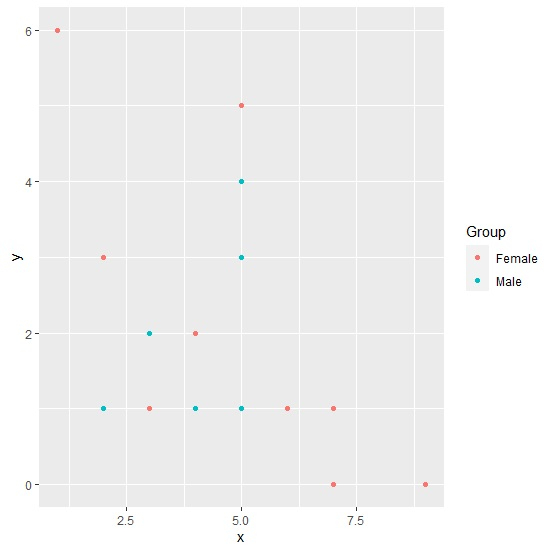
Loading ggplot2 package and creating scatterplot between x and y with different colors for Group values −
Example
library(ggplot2)
ggplot(df,aes(x,y,color=Group))+geom_point()
Output
Creating the scatterplot between x and y with different legend shape −
Example
ggplot(df,aes(x,y,color=Group))+geom_point()+guides(colour=guide_legend(override.aes=list(shape=17)))
Output


Updated on: 2026-03-11T22:50:55+05:30
1K+ Views

Advertisements