
Article Categories
- All Categories
-
 Data Structure
-
 Networking
-
 RDBMS
RDBMS
-
 Operating System
-
 Java
Java
-
 MS Excel
-
 iOS
iOS
-
 HTML
HTML
-
 CSS
CSS
-
 Android
-
 Python
-
 C Programming
-
 C++
C++
-
 C#
C#
-
 MongoDB
-
 MySQL
MySQL
-
 Javascript
-
 PHP
PHP
-
 Economics & Finance
Selected Reading
How to create a scatterplot in R with legend position inside the plot area using ggplot2?
Legends help us to differentiate the values of the response variable while creating the scatterplot. In this way, we can understand how one level of a factor variable affects the response variable. The legend is preferred to be positioned at left bottom, top right, top left, and bottom right. We can use theme function to position the legends.
Example
Consider the below data frame −
> set.seed(99)
> x1<-rnorm(20)
> x2<-rnorm(20,2)
> F<-factor(c("A","B","C","D"))
> df<-data.frame(x1,x2,F)
> library(ggplot2)
Creating the plot with different legend positions −
Consider the below data frame −
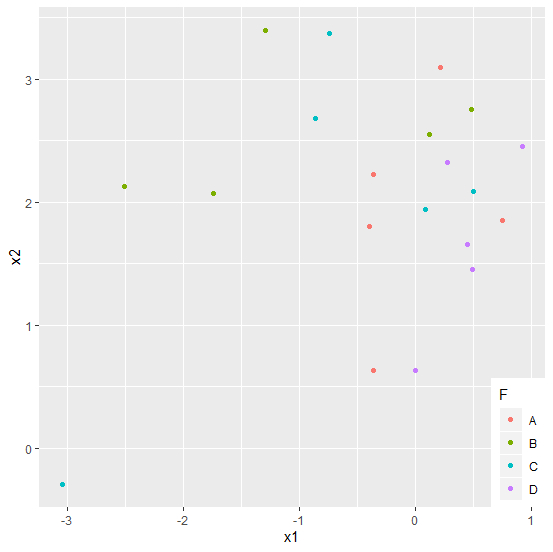
> ggplot(df, aes(x=x1, y=x2, colour=F)) + geom_point(aes(colour=F)) +
+ theme(legend.justification = c(1, 0), legend.position = c(1, 0))
Output
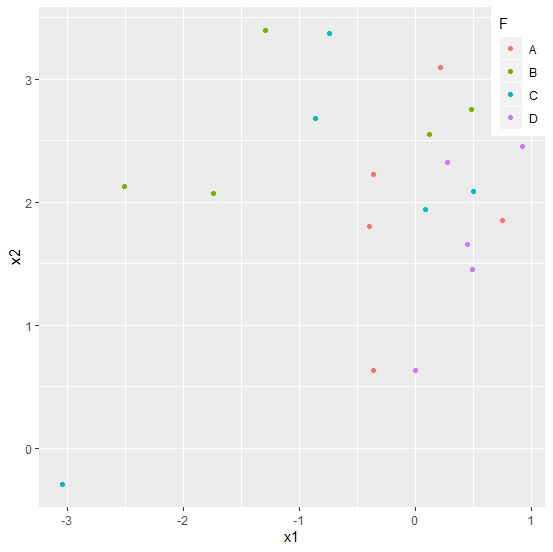
> ggplot(df, aes(x=x1, y=x2, colour=F)) + geom_point(aes(colour=F)) +
+ theme(legend.justification = c(1, 1), legend.position = c(1, 1))
Output
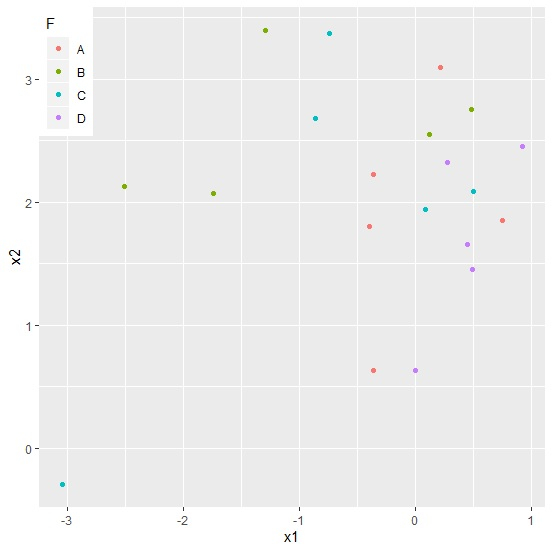
> ggplot(df, aes(x=x1, y=x2, colour=F)) + geom_point(aes(colour=F)) +
+ theme(legend.justification = c(0, 1), legend.position = c(0, 1))
Output
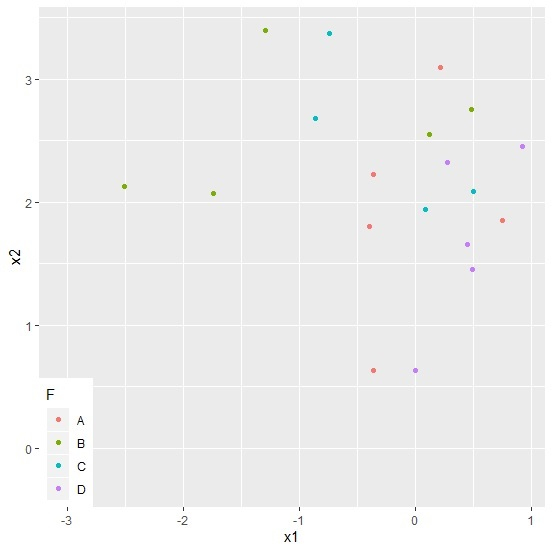
> ggplot(df, aes(x=x1, y=x2, colour=F)) + geom_point(aes(colour=F)) +
+ theme(legend.justification = c(0, 0), legend.position = c(0, 0))
Output

Updated on: 2020-08-12T12:27:10+05:30
383 Views

Advertisements