
Article Categories
- All Categories
-
 Data Structure
-
 Networking
-
 RDBMS
RDBMS
-
 Operating System
-
 Java
Java
-
 MS Excel
-
 iOS
iOS
-
 HTML
HTML
-
 CSS
CSS
-
 Android
-
 Python
-
 C Programming
-
 C++
C++
-
 C#
C#
-
 MongoDB
-
 MySQL
MySQL
-
 Javascript
-
 PHP
PHP
-
 Economics & Finance
Selected Reading
How to create horizontal legend using ggplot2 in R?
The default legend direction is vertical but it can be changed to horizontal as well and for this purpose we can use legend.direction argument of theme function of ggplot2 package. For example, if we want to create a bar chart with x as categories and y as frequencies tjat are contained in a data frame df then the bar chart with horizontal legends for categories in x can be created as −
ggplot(df,aes(x,y,fill=x))+geom_bar(stat="identity")+theme(legend.direction="horizontal")
Example
Consider the below data frame −
> x<-c("A","B","C")
> y<-c(27,25,28)
> df<-data.frame(x,y)
> df
Output
x y
1 A 27
2 B 25
3 C 28
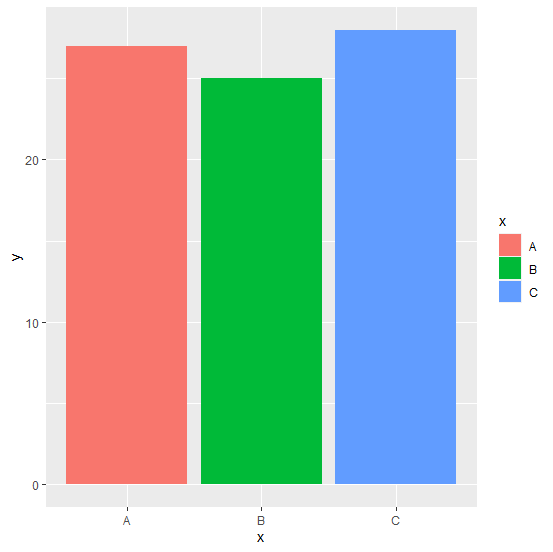
Loading ggplot2 package and creating the bar chart −
Example
> library(ggplot2)
> ggplot(df,aes(x,y,fill=x))+geom_bar(stat="identity")
Output
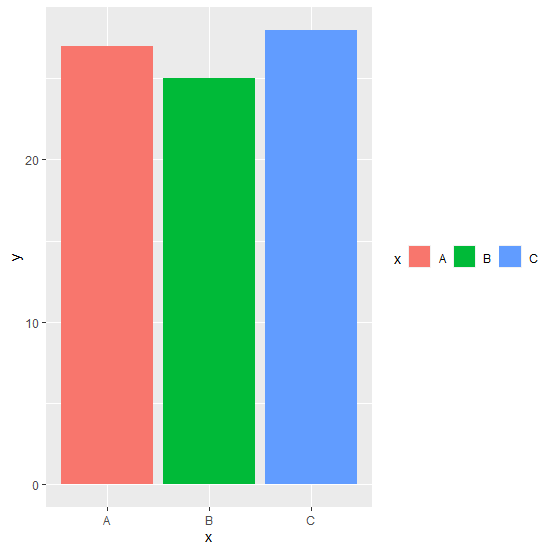
Creating the chart with horizontal legend −
Example
> ggplot(df,aes(x,y,fill=x))+geom_bar(stat="identity")+theme(legend.direction="horizontal")
Output

Updated on: 2026-03-11T22:50:54+05:30
7K+ Views

Advertisements