
Article Categories
- All Categories
-
 Data Structure
-
 Networking
-
 RDBMS
RDBMS
-
 Operating System
-
 Java
Java
-
 MS Excel
-
 iOS
iOS
-
 HTML
HTML
-
 CSS
CSS
-
 Android
-
 Python
-
 C Programming
-
 C++
C++
-
 C#
C#
-
 MongoDB
-
 MySQL
MySQL
-
 Javascript
-
 PHP
PHP
-
 Economics & Finance
How to change the plot border color of a ggplot2 graph in R?
To change the plot border color of a ggplot2 graph in R, we can use theme function with panel.background argument where we can set the border of the plot panel using element_rect to desired color.
To understand how it can be done, check out the below Example.
Example
Following snippet creates a sample data frame −
x<-rnorm(20)
y<-rnorm(20)
df<-data.frame(x,y)
df
The following dataframe is created
             x        y
1   1.309190860  0.34499505
2   1.466722642  0.43439586
3  -0.143056066  1.30347768
4   1.298513726 -0.65169591
5   0.001313548 -0.01688086
6  -0.676410076 -0.56769246
7  -0.848196597 -1.12713287
8  -0.346941100 -1.84897031
9   0.227479443  0.19552906
10 -0.027401404  0.60156523
11  0.200877791  0.63915816
12  0.198942672 -1.38999282
13  0.714599356 -1.12967785
14 -0.273181775 -1.14115419
15  1.635347458 -0.68867150
16  0.437693886  0.17019782
17 -1.193535851  0.59448343
18 -0.276649804 -0.81503265
19  0.515883051 -2.86434684
20 -0.411055332  0.95382348
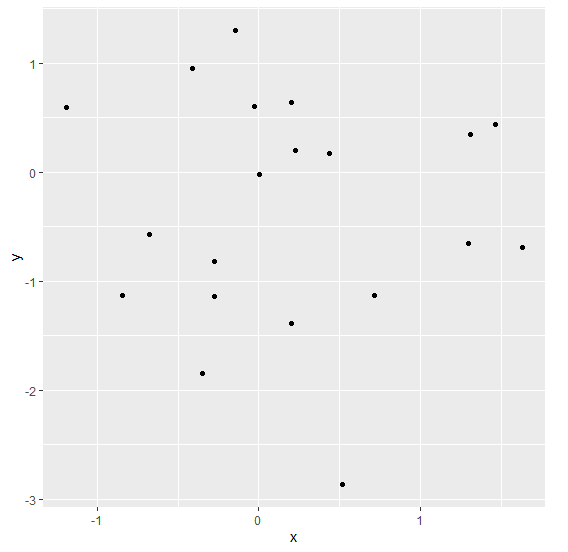
To load ggplot2 package and create scatterplot between x and y on the above created data frame, add the following code to the above snippet −
x<-rnorm(20)
y<-rnorm(20)
df<-data.frame(x,y)
library(ggplot2)
ggplot(df,aes(x,y))+geom_point()
Output
If you execute all the above given snippets as a single program, it generates the following Output −
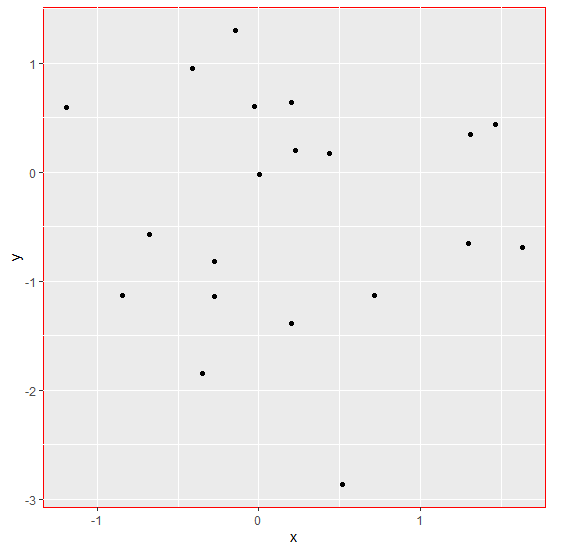
To create scatterplot between x and y with red colored plot border on the above created data frame, add the following code to the above snippet −
x<-rnorm(20)
y<-rnorm(20)
df<-data.frame(x,y)
library(ggplot2)
ggplot(df,aes(x,y))+geom_point()+theme(panel.background=element_rect(colour="red"))
Output
If you execute all the above given snippets as a single program, it generates the following Output −
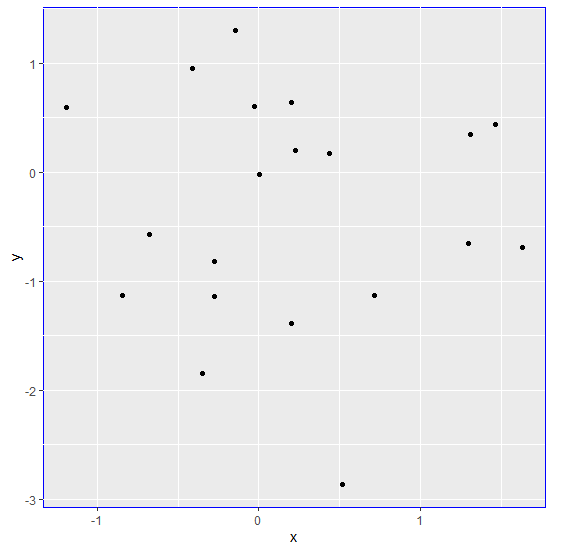
To create scatterplot between x and y with blue colored plot border on the above created data frame, add the following code to the above snippet −
x<-rnorm(20)
y<-rnorm(20)
df<-data.frame(x,y)
library(ggplot2)
ggplot(df,aes(x,y))+geom_point()+theme(panel.background=element_rect(colour="blue"))
Output
If you execute all the above given snippets as a single program, it generates the following Output −

5K+ Views
