
Article Categories
- All Categories
-
 Data Structure
-
 Networking
-
 RDBMS
RDBMS
-
 Operating System
-
 Java
Java
-
 MS Excel
-
 iOS
iOS
-
 HTML
HTML
-
 CSS
CSS
-
 Android
-
 Python
-
 C Programming
-
 C++
C++
-
 C#
C#
-
 MongoDB
-
 MySQL
MySQL
-
 Javascript
-
 PHP
PHP
-
 Economics & Finance
How to change the position of X-axis in base R plot?
By default, the position of X-axis is at the bottom and we know that it is always there in all software/programming tools. If we want to change the position of X-axis in base R plot then we can use axis function with pos argument. The pos argument will decide the position of the X-axis on Y-axis.
Check out the Example mentioned below to understand how it can be done.
Example
To change the position of X-axis in base R plot, use the following command −
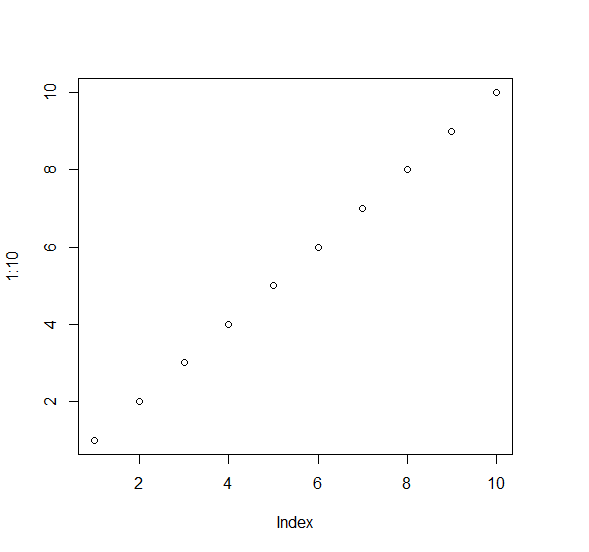
plot(1:10)
Output
If you execute the above given snippet, it generates the following Output −
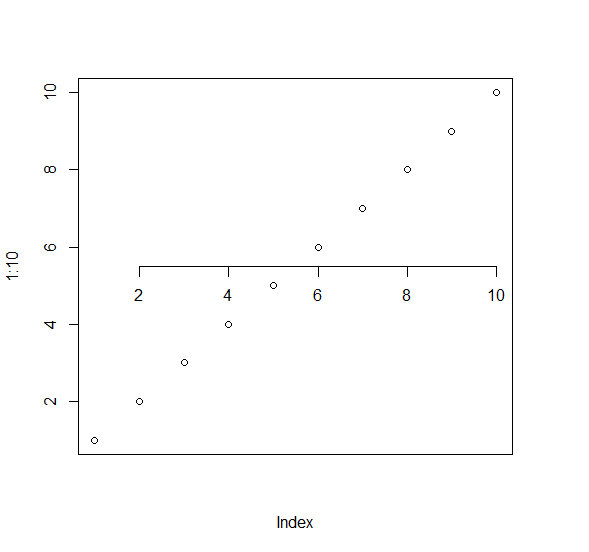
To create a point chart with X-axis at 5.5 on Y-axis on the above created data frame, add the following code to the above snippet −
plot(1:10,xaxt="n")
axis(1,pos=5.5)
Output
If you execute all the above given snippets as a single program, it generates the following Output −

4K+ Views
