
Article Categories
- All Categories
-
 Data Structure
-
 Networking
-
 RDBMS
RDBMS
-
 Operating System
-
 Java
Java
-
 MS Excel
-
 iOS
iOS
-
 HTML
HTML
-
 CSS
CSS
-
 Android
-
 Python
-
 C Programming
-
 C++
C++
-
 C#
C#
-
 MongoDB
-
 MySQL
MySQL
-
 Javascript
-
 PHP
PHP
-
 Economics & Finance
Selected Reading
How to use mtext function to create the X-axis labels in base R?
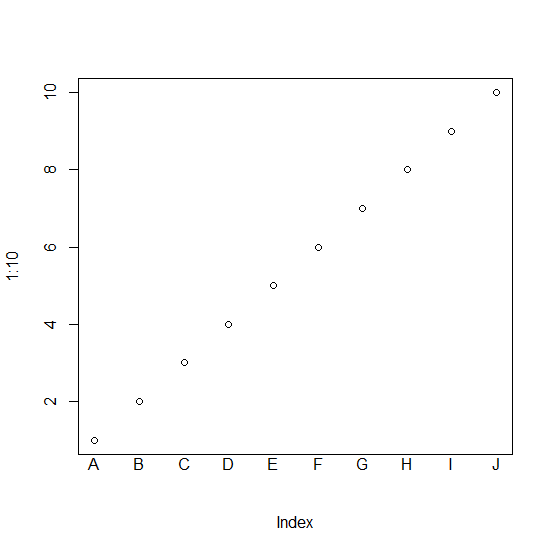
The mtext function can help us to create X-axis or Y-axis labels and we can put these labels to places desired by us with the help of at argument. For example, if we want to use capital letters starting from A to J that are 10 characters on the X-axis labels then it can be done by using the below command −
mtext(text=LETTERS[1:10],outer=FALSE,side=1,las=1,at=1:10)
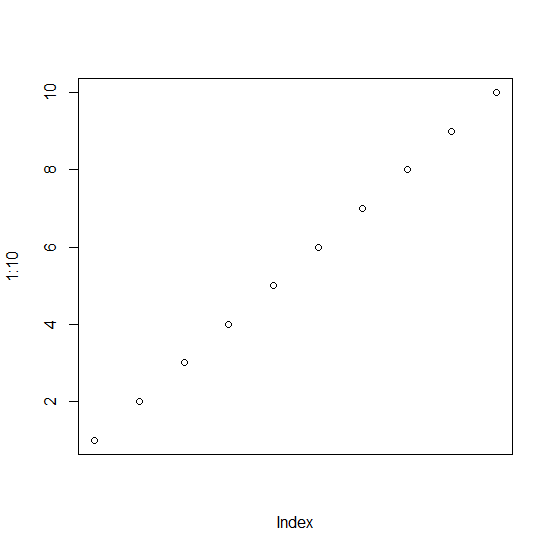
Example
> plot(1:10,xaxt="n")
Output
Example
> mtext(text=LETTERS[1:10],outer=FALSE,side=1,las=1,at=1:10)
Output

Updated on: 2021-01-04T06:42:25+05:30
392 Views

Advertisements