
Article Categories
- All Categories
-
 Data Structure
-
 Networking
-
 RDBMS
RDBMS
-
 Operating System
-
 Java
Java
-
 MS Excel
-
 iOS
iOS
-
 HTML
HTML
-
 CSS
CSS
-
 Android
-
 Python
-
 C Programming
-
 C++
C++
-
 C#
C#
-
 MongoDB
-
 MySQL
MySQL
-
 Javascript
-
 PHP
PHP
-
 Economics & Finance
Selected Reading
How to create stacked barplot using barplot function in R?
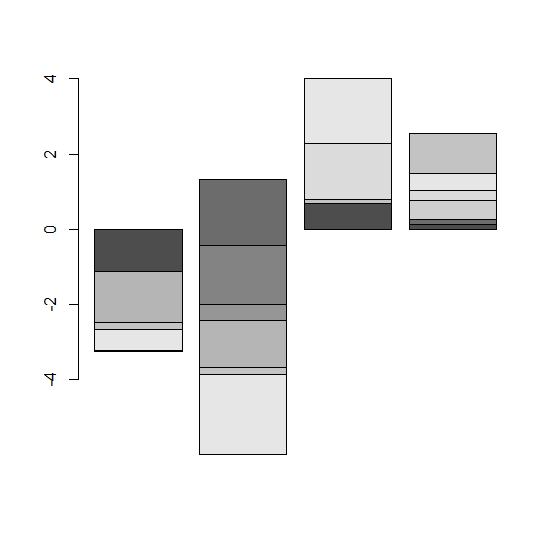
To create a stacked barplot using barplot function we need to use matrix instead of a data frame object because in R barplot function can be used for a vector or for a matrix only. We must be very careful if we want to create a stacked bar plot using barplot function because bar plots are created for count data only. Here, you will see some examples of count as well as continuous data, carefully read the graphs and understand how the graphs are different from each other.
Example1
M1<−matrix(rnorm(40),ncol=4)
M1
Output
      [,1]       [,2]       [,3]       [,4]
[1,] −1.3035243 1.3221939 1.9557782 0.1202694
[2,] −1.2548522 −1.7679306 0.5101073 0.9979115
[3,] 0.1095688 −1.5652809 1.1426236 −0.2278059
[4,] 0.6143122 −0.6680945 −0.9518161 0.7849978
[5,] 0.7078449 0.2490338 −1.1855153 0.3580386
[6,] −1.3651111 −1.2632633 −0.7954036 0.5127274
[7,] −0.4638549 −0.9650625 0.7063811 −2.2920743
[8,] −0.3006626 0.6249937 −0.5921453 0.5214382
[9,] 0.5874841 0.1630416 1.4858325 0.2483941
[10,] −0.5604357 −2.1200705 1.7315785 0.4596253
Example
barplot(M1)
Output
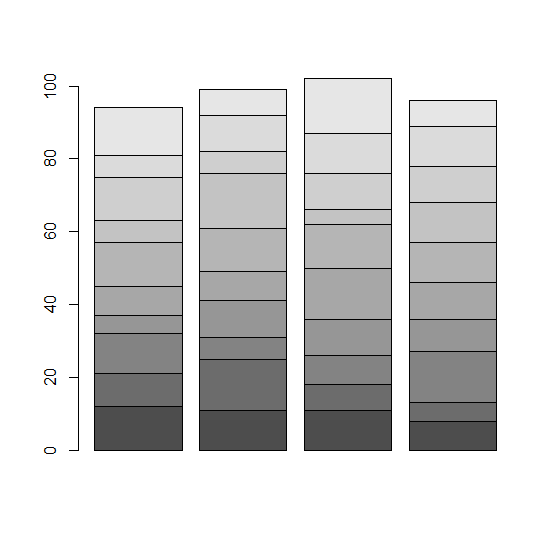
Example2
M2<−matrix(rpois(40,10),ncol=4)
M2
Output
[,1] [,2] [,3] [,4]
[1,] 12 11 11 8
[2,] 9 14 7 5
[3,] 11 6 8 14
[4,] 5 10 10 9
[5,] 8 8 14 10
[6,] 12 12 12 11
[7,] 6 15 4 11
[8,] 12 6 10 10
[9,] 6 10 11 11
[10,] 13 7 15 7
Example
barplot(M2)
Output
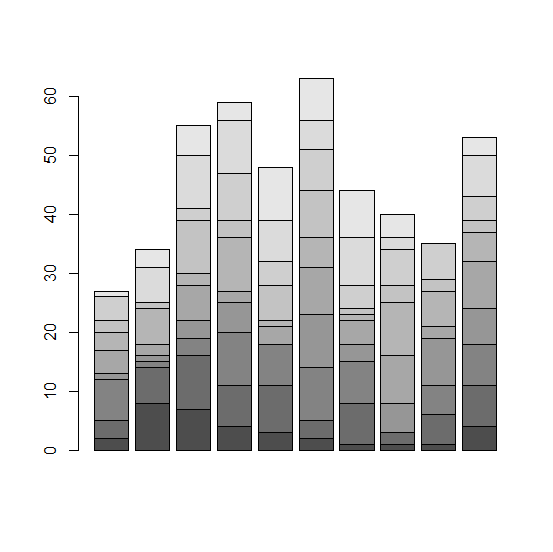
Example3
M3<−matrix(sample(0:9,100,replace=TRUE),ncol=10)
M3
Output
      [,1]    [,2]    [,3]    [,4]    [,5]    [,6]    [,7]    [,8]    [,9]    [,10]
[1,]    2       8       7       4       3       2       1       1       1       4
[2,]    3       6       9       7       8       3       7       2       5       7
[3,]    7       1       3       9       7       9       7       0       5       7
[4,]    1       1       3       5       0       9       3       5       8       6
[5,]    4       2       6       2       3       8       4       8       2       8
[6,]    3       6       2       9       1       5       1       9       6       5
[7,]    2       1       9       3       6       8       1       3       2       2
[8,]    4       0       2       8       4       7       4       6       6       4
[9,]    0       6       9       9       7       5       8       2       0       7
[10,]    1       3       5       3       9       7       8       4       0       3
Example
barplot(M3)
Output

Updated on: 2026-03-11T22:50:53+05:30
546 Views

Advertisements