
Article Categories
- All Categories
-
 Data Structure
-
 Networking
-
 RDBMS
RDBMS
-
 Operating System
-
 Java
Java
-
 MS Excel
-
 iOS
iOS
-
 HTML
HTML
-
 CSS
CSS
-
 Android
-
 Python
-
 C Programming
-
 C++
C++
-
 C#
C#
-
 MongoDB
-
 MySQL
MySQL
-
 Javascript
-
 PHP
PHP
-
 Economics & Finance
Selected Reading
How to create varying width bar chart using barplot function in R?
The barplot function create the bars of equal width but if we have equal or unequal width values for each bar then we can use width within the barplot function. Thus, the newly generated barplot will have different width of the bars. For example, if we the width are defined for four categories as 0.25 each then each bar will be of equal width and if they vary as 0.30, 0.40, 0.20, 0.45 then the width of the bars will be different based on these widths.
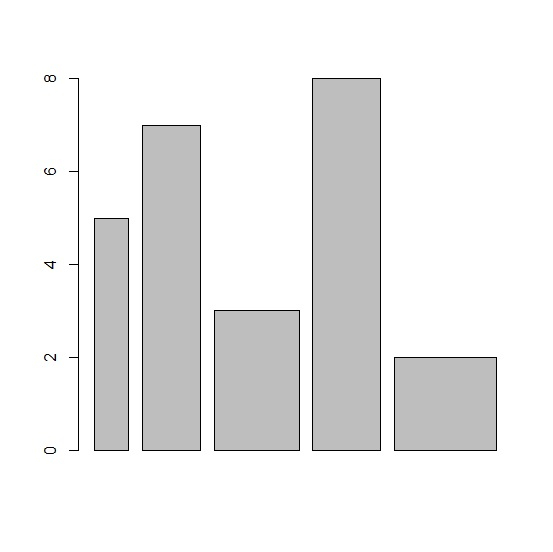
Consider the below vector x and the corresponding width vector −
x<-c(5,7,3,8,2)
width<-c(0.2,0.34,0.5,0.4,0.6)
Creating the barplot for x by defining width with width vector −
Example
barplot(x,width)
Output
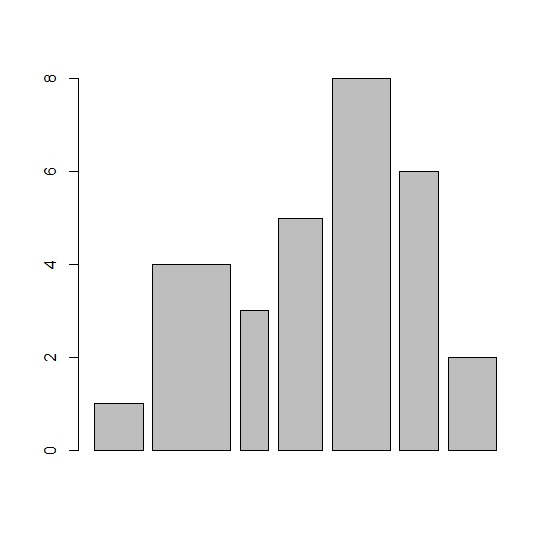
Example
y<-c(1,4,3,5,8,6,2)
width<-c(0.5,0.8,0.3,0.45,0.6,0.4,0.5) barplot(y,width)
Output

Updated on: 2020-10-14T12:17:16+05:30
403 Views

Advertisements