
Article Categories
- All Categories
-
 Data Structure
-
 Networking
-
 RDBMS
RDBMS
-
 Operating System
-
 Java
Java
-
 MS Excel
-
 iOS
iOS
-
 HTML
HTML
-
 CSS
CSS
-
 Android
-
 Python
-
 C Programming
-
 C++
C++
-
 C#
C#
-
 MongoDB
-
 MySQL
MySQL
-
 Javascript
-
 PHP
PHP
-
 Economics & Finance
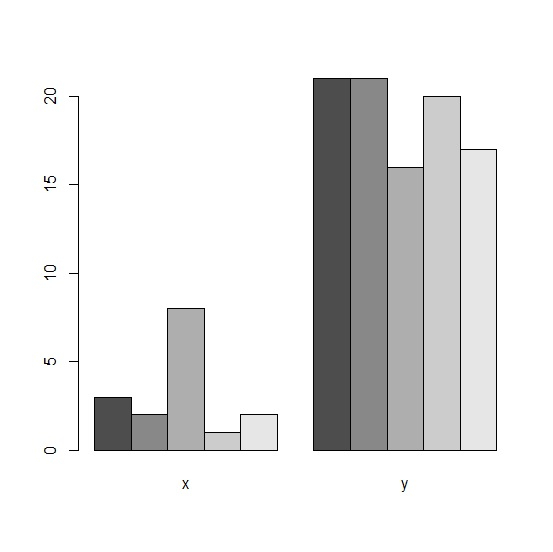
How to create side by side barplot in base R?
If we want to create side by side barplot for two vectors or two columns of same or different data frames then we first need to combine those vectors or columns with the help of cbind function as shown below. After that barplot function will be applied to the combined data and beside argument will be set to TRUE.
Check out the below given example to understand how it works.
Example
To create side by side barplot in base R, use the code given below −
xIf you execute the above given code, it generates the following output −
[1] 3 2 8 1 2To create side by side barplot in base R, add the following code to the above snippet −
yIf you execute all the above given snippets as a single program, it generates the following output −
[1] 21 21 16 20 17To create side by side barplot in base R, add the following code to the above snippet −
xOutput
If you execute all the above given snippets as a single program, it generates the following output −

2K+ Views
