
Article Categories
- All Categories
-
 Data Structure
-
 Networking
-
 RDBMS
RDBMS
-
 Operating System
-
 Java
Java
-
 MS Excel
-
 iOS
iOS
-
 HTML
HTML
-
 CSS
CSS
-
 Android
-
 Python
-
 C Programming
-
 C++
C++
-
 C#
C#
-
 MongoDB
-
 MySQL
MySQL
-
 Javascript
-
 PHP
PHP
-
 Economics & Finance
Selected Reading
How to create a horizontal bar plot using barplot function in R?
To create a bar plot in base R, we can directly use barplot function but the table of frequencies should be passed inside this function. If we want to create the barplot in horizontal manner then horiz=TRUE argument must be added. For example, if we have a vector x that contains repeating values then the horizontal bar plot of x can be created by using barplot(table(x),horiz=TRUE).
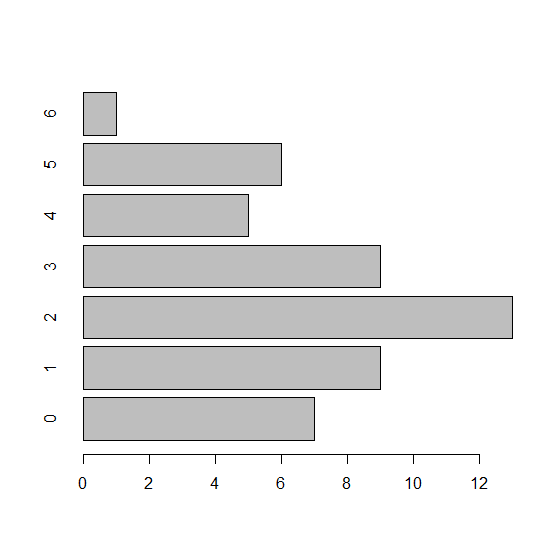
Example1
> x<-rpois(50,2)
> barplot(table(x),horiz=TRUE)
Output
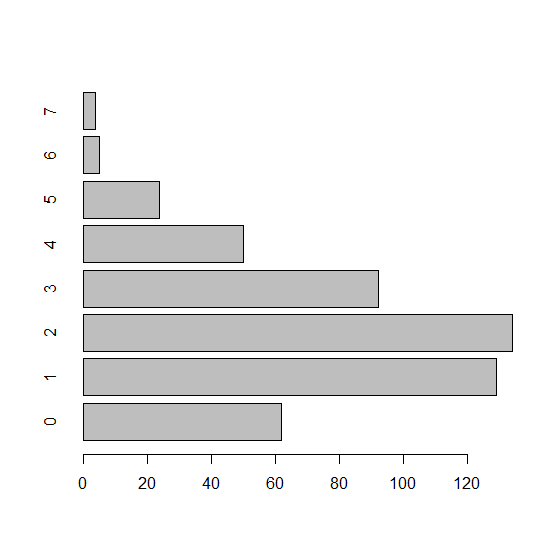
Example2
> y<-rpois(500,2)
> barplot(table(y),horiz=TRUE)
Output
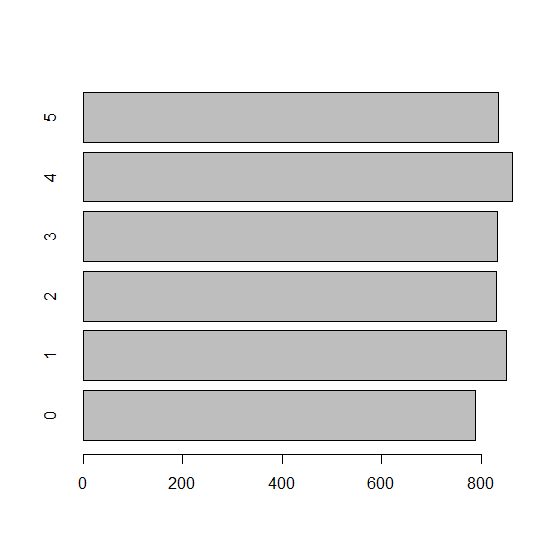
Example3
> z<-sample(0:5,5000,replace=TRUE)
> barplot(table(z),horiz=TRUE)
Output

Updated on: 2020-11-21T05:31:01+05:30
289 Views

Advertisements