
Article Categories
- All Categories
-
 Data Structure
-
 Networking
-
 RDBMS
RDBMS
-
 Operating System
-
 Java
Java
-
 MS Excel
-
 iOS
iOS
-
 HTML
HTML
-
 CSS
CSS
-
 Android
-
 Python
-
 C Programming
-
 C++
C++
-
 C#
C#
-
 MongoDB
-
 MySQL
MySQL
-
 Javascript
-
 PHP
PHP
-
 Economics & Finance
Selected Reading
How to create boxplot for multiple categories in base R?
To create the boxplot for multiple categories, we should create a vector for categories and construct data frame for categorical and numerical column. Once the construction of the data frame is done, we can simply use boxplot function in base R to create the boxplots by using tilde operator as shown in the below example.
Example
Consider the below data frame −
Categories<-sample(LETTERS[1:5],500,replace=TRUE)
Rate<-rnorm(500,8,2)
df<-data.frame(Categories,Rate)
head(df,20)
Output
  Categories    Rate
1    C       4.618484
2    B       8.513390
3    A       9.071579
4    B       9.744654
5    C       5.963608
6    E       9.959320
7    A       9.803821
8    D       7.420664
9    C       7.776794
10   C       4.810012
11   B       8.556322
12   E       8.621443
13   B       7.353419
14   B       6.690489
15   A       12.806544
16   D       8.008669
17   B       10.102333
18   A       4.799457
19   D       6.999711
20   D       10.013520
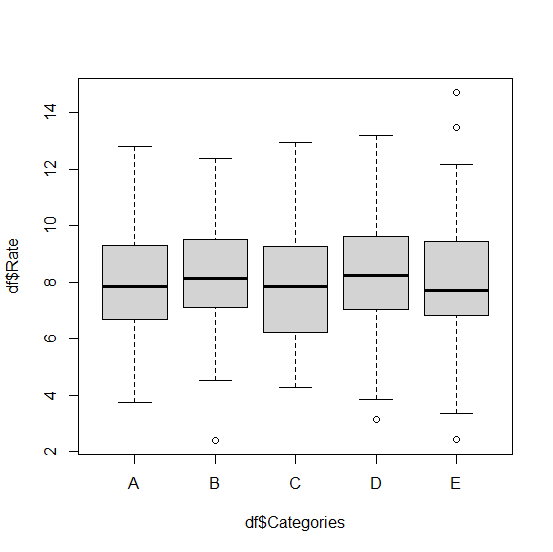
Creating boxplot of Rate for categories −
Example
boxplot(df$Rate~df$Categories)
Output

Updated on: 2026-03-11T22:50:52+05:30
2K+ Views

Advertisements