
Article Categories
- All Categories
-
 Data Structure
-
 Networking
-
 RDBMS
RDBMS
-
 Operating System
-
 Java
Java
-
 MS Excel
-
 iOS
iOS
-
 HTML
HTML
-
 CSS
CSS
-
 Android
-
 Python
-
 C Programming
-
 C++
C++
-
 C#
C#
-
 MongoDB
-
 MySQL
MySQL
-
 Javascript
-
 PHP
PHP
-
 Economics & Finance
Selected Reading
How to create different Y-axis for group levels using ggplot2 in R?
If we have a categorical variable or a group variable then we might want to create a line chart for each of the categories or levels, this will help us to understand the range of multiple levels in a single plot. For this purpose, we can use facet_grid function of ggplot2 package as shown in the below example.
Example
Consider the below data frame:
> x<-sample(LETTERS[1:4],20,replace=TRUE)
> y<-rnorm(20)
> df<-data.frame(x,y)
> df
Output
   x     y
1 C  -1.55668689
2 A   2.41399136
3 D  -0.78520253
4 A  -0.43092594
5 C   1.94379390
6 A   0.17494763
7 C  -1.61170476
8 A  -1.55362764
9 C  -0.53384492
10 A -0.66698812
11 D  1.44100518
12 D  1.10126743
13 D -1.54194367
14 B -0.03254252
15 A -0.63927406
16 A  1.72924629
17 A -0.10003278
18 B -0.08262660
19 C  1.29335456
20 A -1.50531507
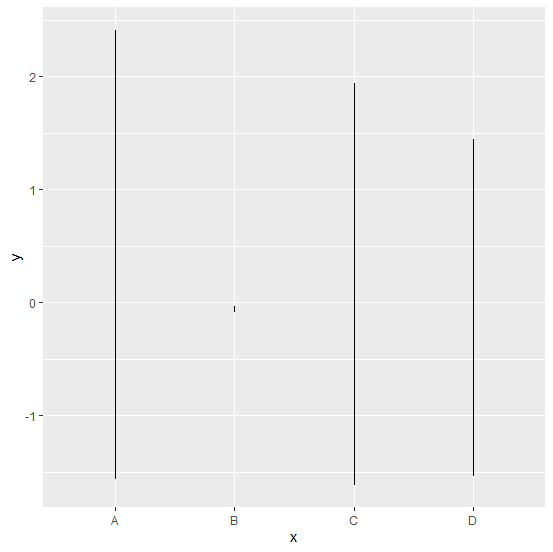
Loading ggplot2 package and creating a line chart for each of the levels in x:
Example
> library(ggplot2)
> ggplot(df,aes(x,y))+geom_line()
Output:
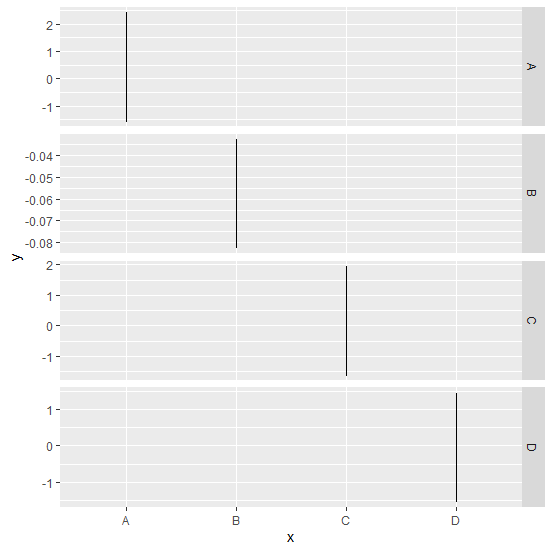
Creating the line chart for each level of x but with different scales of Y-axis chosen by R freely based on the given data:
Example
> ggplot(df,aes(x,y))+geom_line()+facet_grid(x~.,scales="free")
Output:

Updated on: 2026-03-11T22:50:53+05:30
1K+ Views

Advertisements