
Article Categories
- All Categories
-
 Data Structure
-
 Networking
-
 RDBMS
RDBMS
-
 Operating System
-
 Java
Java
-
 MS Excel
-
 iOS
iOS
-
 HTML
HTML
-
 CSS
CSS
-
 Android
-
 Python
-
 C Programming
-
 C++
C++
-
 C#
C#
-
 MongoDB
-
 MySQL
MySQL
-
 Javascript
-
 PHP
PHP
-
 Economics & Finance
Selected Reading
How to create a plot in base R with dates sequence on X-axis?
If we have a vector that contains dates as sequence that needs to be plotted on the X-axis and another vector for the response then the plot can be simply created by using the plot function. In the plot function, we would need to pass the dates as the first argument and the response vector as the second argument. Check ou the examples below to understand how it works.
Example
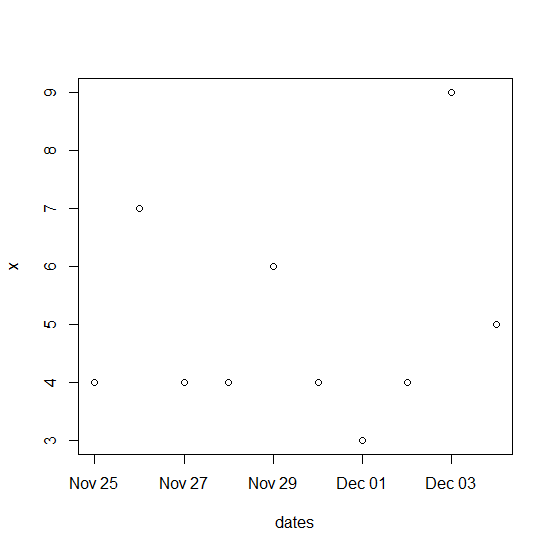
x<-rpois(10,5)
x
Output
[1] 4 7 4 4 6 4 3 4 9 5
Example
dates<-seq(as.Date("25/11/2020",format="%d/%m/%Y"),by="days",length=length(x))
dates
Output
[1] "2020-11-25" "2020-11-26" "2020-11-27" "2020-11-28" "2020-11-29"
[6] "2020-11-30" "2020-12-01" "2020-12-02" "2020-12-03" "2020-12-04"
Example
plot(dates,x)
Output
Example
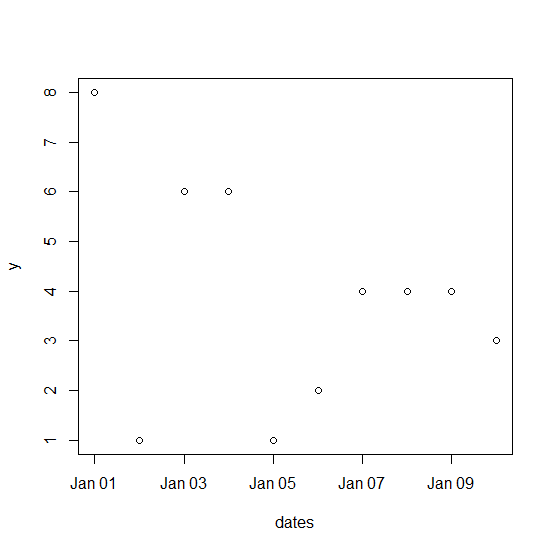
y<-sample(0:9,10,replace=TRUE)
dates<-seq(as.Date("01/01/2020",format="%d/%m/%Y"),by="days",length=length(x))
plot(dates,y)
Output

Updated on: 2026-03-11T22:50:54+05:30
2K+ Views

Advertisements