
Article Categories
- All Categories
-
 Data Structure
-
 Networking
-
 RDBMS
RDBMS
-
 Operating System
-
 Java
Java
-
 MS Excel
-
 iOS
iOS
-
 HTML
HTML
-
 CSS
CSS
-
 Android
-
 Python
-
 C Programming
-
 C++
C++
-
 C#
C#
-
 MongoDB
-
 MySQL
MySQL
-
 Javascript
-
 PHP
PHP
-
 Economics & Finance
Selected Reading
How to create a plot of quadratic regression with fitted values against X in base R?
The quadratic regression model can be plotted by using the plot function but we would need to find the fitted values using the model and this can be done with the help of fitted function. For example, if we have a quadratic model M and the data has an independent variable x then the model against x can be created by using plot(x,fitted(M)).
Example
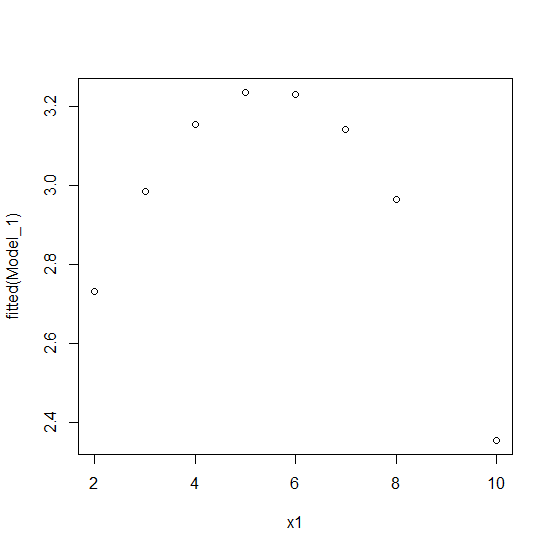
x1<-rpois(10,5)
y1<-rpois(10,2)
Model_1<-lm(y1~x1+I(x1^2))
plot(x1,fitted(Model_1))
Output
Example
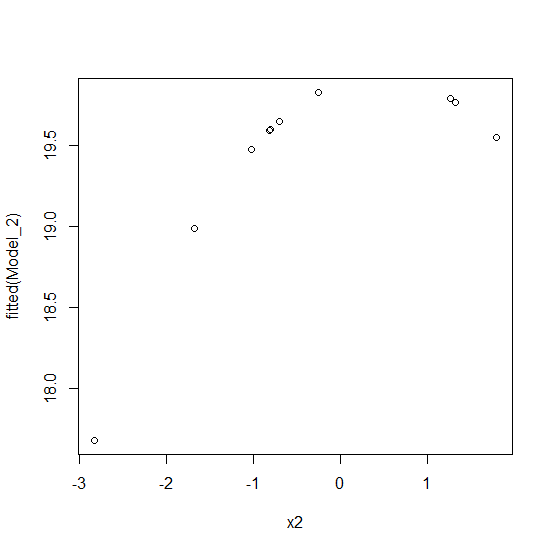
x2<-rnorm(10)
y2<-rnorm(10,20,2.27)
Model_2<-lm(y2~x2+I(x2^2))
plot(x2,fitted(Model_2))
Output

Updated on: 2026-03-11T22:50:54+05:30
296 Views

Advertisements