
Article Categories
- All Categories
-
 Data Structure
-
 Networking
-
 RDBMS
RDBMS
-
 Operating System
-
 Java
Java
-
 MS Excel
-
 iOS
iOS
-
 HTML
HTML
-
 CSS
CSS
-
 Android
-
 Python
-
 C Programming
-
 C++
C++
-
 C#
C#
-
 MongoDB
-
 MySQL
MySQL
-
 Javascript
-
 PHP
PHP
-
 Economics & Finance
Selected Reading
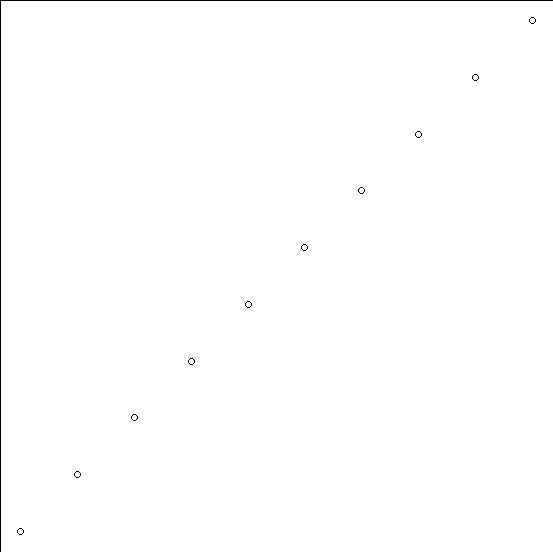
How to create a plot in base R without margins?
To create a plot without margins, we first need to define that margin in a way that the plot created after that will not have margins and this can be done by using par function. We would need to pass mar function within par function as par(mar=c(0,0,0,0)).
Example
par(mar=c(0,0,0,0))
plot(1:10)
Output
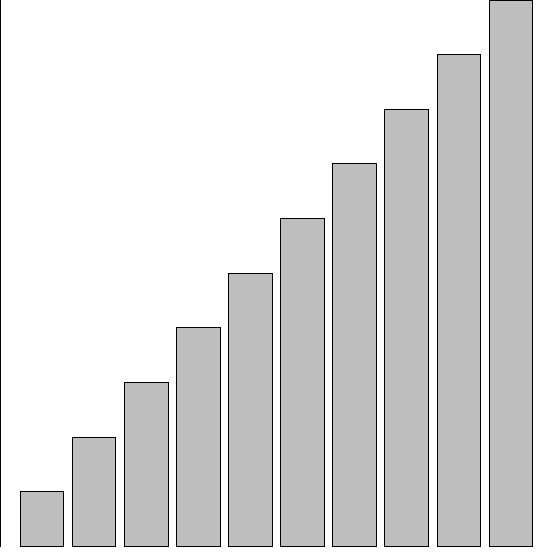
Example
barplot(1:10)
Output

Updated on: 2026-03-11T22:50:54+05:30
742 Views

Advertisements