
Article Categories
- All Categories
-
 Data Structure
-
 Networking
-
 RDBMS
RDBMS
-
 Operating System
-
 Java
Java
-
 MS Excel
-
 iOS
iOS
-
 HTML
HTML
-
 CSS
CSS
-
 Android
-
 Python
-
 C Programming
-
 C++
C++
-
 C#
C#
-
 MongoDB
-
 MySQL
MySQL
-
 Javascript
-
 PHP
PHP
-
 Economics & Finance
Selected Reading
How to change the axis ticks color in base R plot?
To change the axis ticks color in base R plot, we can use axis function after creating the plot. For example if we want to change the color of X-axis to red then we can use the command given below −
axis(1,col.ticks="red")
If we want to change the color of Y-axis to red then we can use the command given below −
axis(2,col.ticks="red")
Check out the below given example to understand how it works.
Example
To change the axis ticks color in base R plot, use the code given below −
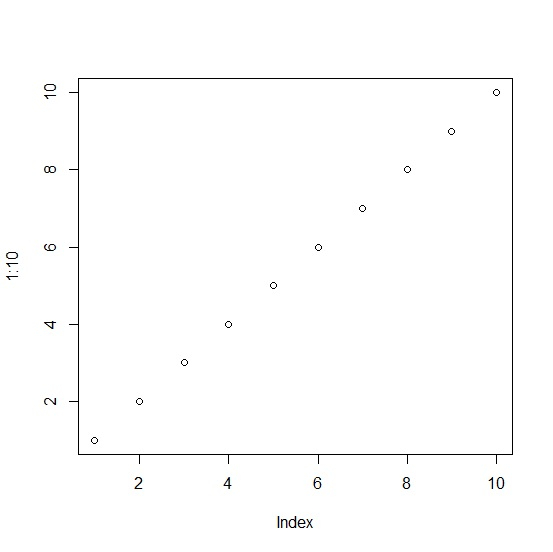
plot(1:10)
Output
If you execute the above given code, it generates the following output −
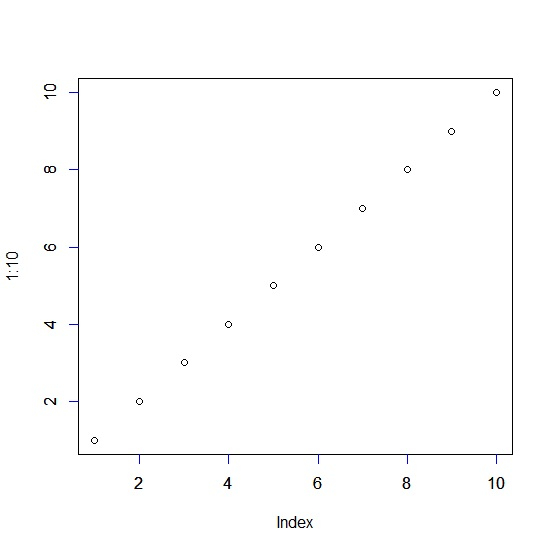
To change the axis ticks color in base R plot, add the following code to the above snippet −
plot(1:10)
axis(1,col.ticks="blue")
axis(2,col.ticks="blue")
Output
If you execute all the above given codes as a single program, it generates the following output −

Updated on: 2021-11-12T07:28:15+05:30
1K+ Views

Advertisements