
Article Categories
- All Categories
-
 Data Structure
-
 Networking
-
 RDBMS
RDBMS
-
 Operating System
-
 Java
Java
-
 MS Excel
-
 iOS
iOS
-
 HTML
HTML
-
 CSS
CSS
-
 Android
-
 Python
-
 C Programming
-
 C++
C++
-
 C#
C#
-
 MongoDB
-
 MySQL
MySQL
-
 Javascript
-
 PHP
PHP
-
 Economics & Finance
Selected Reading
How to create a bar plot using ggplot2 with one bar having black border in R?
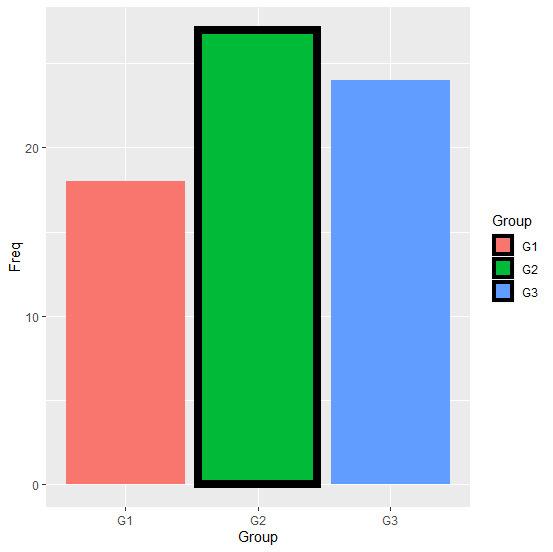
The bar plot can be easily created with the help of geom_bar. But if we want to have a different border for a particular bar then we first need to create the bar plot and store it in an object. After that we need to add the original plot with the bar for which we want to have a black border. Check out the below example to understand how it can be done.
Example
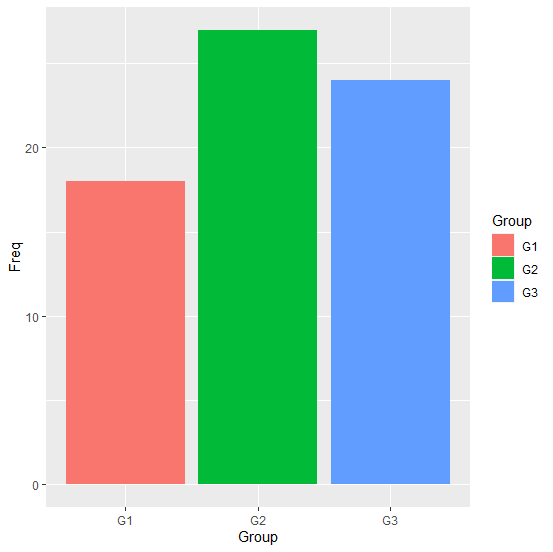
Consider the below data frame:
> Group<-c("G1","G2","G3")
> Freq<-c(18,27,24)
> df<-data.frame(Group,Freq)
> df
Output
 Group Freq
1 G1   18
2 G2   27
3 G3   24
Loading ggplot2 package and creating a bar plot:
Example
> library(ggplot2)
> p<-ggplot(df,aes(Group,Freq,fill=Group))+geom_bar(stat="identity")
> p
Output:
Adding the bar plot with bar having black color border:
Example
> p+geom_bar(data=df[(df$Group=="G2"),],stat="identity",
+ aes(Group),size=3,color="black")
Output:

Updated on: 2026-03-11T22:50:53+05:30
1K+ Views

Advertisements