
Article Categories
- All Categories
-
 Data Structure
-
 Networking
-
 RDBMS
RDBMS
-
 Operating System
-
 Java
Java
-
 MS Excel
-
 iOS
iOS
-
 HTML
HTML
-
 CSS
CSS
-
 Android
-
 Python
-
 C Programming
-
 C++
C++
-
 C#
C#
-
 MongoDB
-
 MySQL
MySQL
-
 Javascript
-
 PHP
PHP
-
 Economics & Finance
Selected Reading
How to change the angle of annotated text in plot created by using ggplot2 in R?
To annotate the text inside a plot created by ggplot2, we can use annotate function. It is used to give some explanation about the plot or add any useful information that will help readers to understand the plot in a better way. Sometimes, we might want to change the angle of the annotated text, especially in cases where we have some information that is presented vertically in the plot, therefore, we can use angle argument of the annotate function.
Example
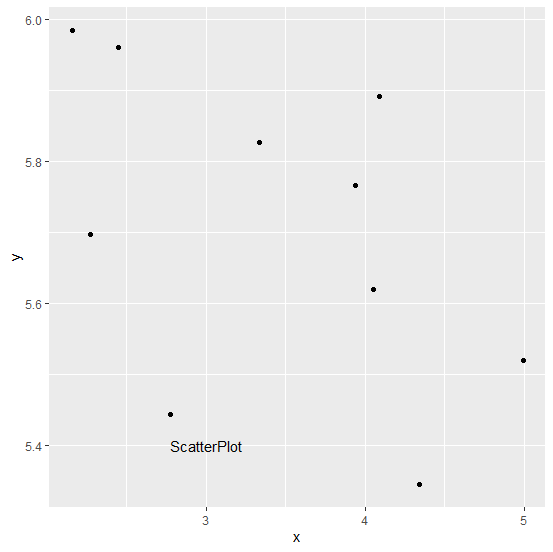
Consider the below data frame −
> x<-runif(10,2,5)
> y<-runif(10,5,6)
> df<-data.frame(x,y)
> df
Output
      x       y
1 4.086537 5.890591
2 2.271184 5.697052
3 3.335322 5.827102
4 2.155897 5.984699
5 4.054110 5.620492
6 3.936053 5.766108
7 4.341102 5.345369
8 2.450337 5.960743
9 4.992243 5.520061
10 2.776401 5.443892
Loading ggplot2 package and creating a plot with annotated text −
> library(ggplot2)
> ggplot(df,aes(x,y))+geom_point()+annotate("text",x=3,y=5.4,label="ScatterPlot")
Output
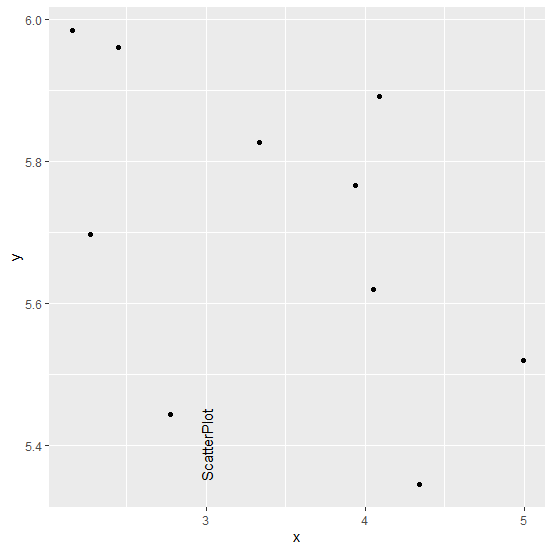
Changing the angle of text “ScatterPlot” −
> ggplot(df,aes(x,y))+geom_point()+annotate("text",x=3,y=5.4,label="ScatterPlot",angle=9
0)
Output

Updated on: 2026-03-11T22:50:51+05:30
366 Views

Advertisements