- ggplot2 - Home
- ggplot2 - Introduction
- ggplot2 - Installation of R
- ggplot2 - Default Plot in R
- ggplot2 - Working with Axes
- ggplot2 - Working with Legends
- ggplot2 - Scatter Plots & Jitter Plots
- ggplot2 - Bar Plots & Histograms
- ggplot2 - Pie Charts
- ggplot2 - Marginal Plots
- ggplot2 - Bubble Plots & Count Charts
- ggplot2 - Diverging Charts
- ggplot2 - Themes
- ggplot2 - Multi Panel Plots
- ggplot2 - Multiple Plots
- ggplot2 - Background Colors
- ggplot2 - Time Series
- ggplot2 Useful Resources
- ggplot2 - Quick Guide
- ggplot2 - Useful Resources
- ggplot2 - Discussion
ggplot2 - Installation of R
R packages come with various capabilities like analyzing statistical information or getting in depth research of geospatial data or simple we can create basic reports.
Packages of R can be defined as R functions, data and compiled code in a well-defined format. The folder or directory where the packages are stored is called the library.
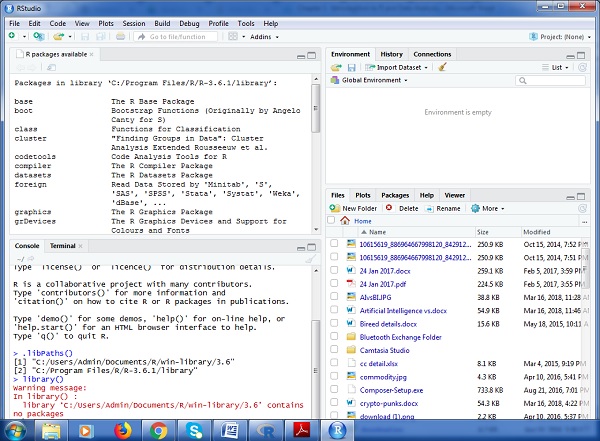
As visible in the above figure, libPaths() is the function which displays you the library which is located, and the function library shows the packages which are saved in the library.
R includes number of functions which manipulates the packages. We will focus on three major functions which is primarily used, they are −
- Installing Package
- Loading a Package
- Learning about Package
The syntax with function for installing a package in R is −
Install.packages(<package-name>)
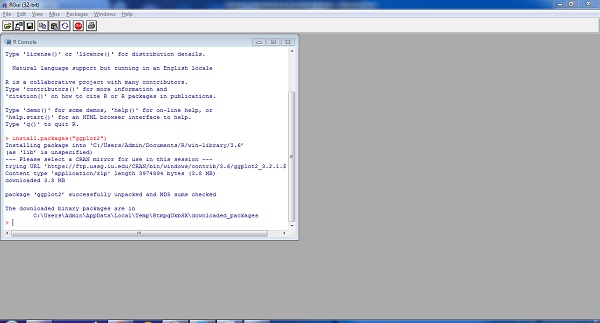
The simple demonstration of installing a package is visible below. Consider we need to install package ggplot2 which is data visualization library, the following syntax is used −
Install.packages(ggplot2)
To load the particular package, we need to follow the below mentioned syntax −
Library(<package-name>)
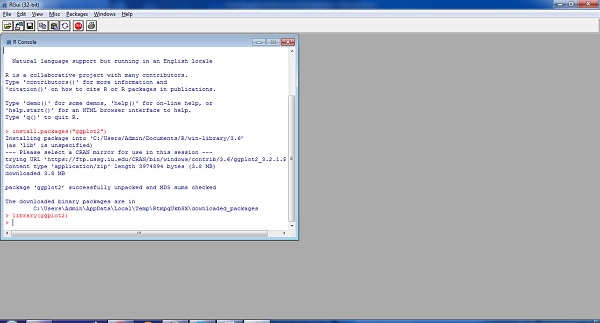
The same applies for ggplot2 as mentioned below −
library(ggplot2)
The output is depicted in snapshot below −
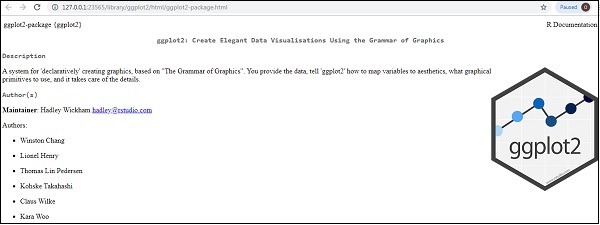
To understand the need of required package and basic functionality, R provides help function which gives the complete detail of package which is installed.
The complete syntax is mentioned below −
help(ggplot2)