
Article Categories
- All Categories
-
 Data Structure
-
 Networking
-
 RDBMS
RDBMS
-
 Operating System
-
 Java
Java
-
 MS Excel
-
 iOS
iOS
-
 HTML
HTML
-
 CSS
CSS
-
 Android
-
 Python
-
 C Programming
-
 C++
C++
-
 C#
C#
-
 MongoDB
-
 MySQL
MySQL
-
 Javascript
-
 PHP
PHP
-
 Economics & Finance
Selected Reading
How to display regression slope using model in a plot created by ggplot2 in R?
To display regression slope using model in a plot created by ggplot2, we can follow the below steps −
- First of all, create the data frame.
- Use annotate function of ggplot2 to create the scatterplot with regression slope displayed on the plot.
- Check the regression slope.
Create the data frame
Let's create a data frame as shown below −
x<-rnorm(25)
y<-rnorm(25)
df<-data.frame(x,y)
df
On executing, the above script generates the below output(this output will vary on your system due to randomization) −
      x          y
1 -0.3344355 -1.107060779
2 0.9164450 -2.499279489
3 -1.2110213 -1.232242802
4 -0.2469611 -0.002048849
5 0.8153152 0.096430178
6 1.5256898 0.366641036
7 0.2477990 -0.887210596
8 -0.5315179 1.594046357
9 -0.3118217 -0.059540798
10 -2.3218482 -0.578005944
11 -0.2519221 -1.470768208
12 0.8210061 -0.252782378
13 0.3679411 0.907479636
14 -1.1653608 -1.645537248
15 -2.7027016 -0.543878325
16 -0.2973516 0.217316266
17 0.1234872 0.749658413
18 1.1059414 0.204091591
19 0.6868014 0.976441196
20 -1.2037182 0.560449928
21 0.1567828 -0.799122836
22 0.5292457 -2.364608009
23 -0.9377216 0.347594404
24 0.5401030 -1.615585141
25 -0.5440631 0.637820747
Create the scatterplot with regression slope
Creating the scatterplot with regression line and slope of the model displayed on the plot −
x<-rnorm(25)
y<-rnorm(25)
df<-data.frame(x,y)
library(ggplot2)
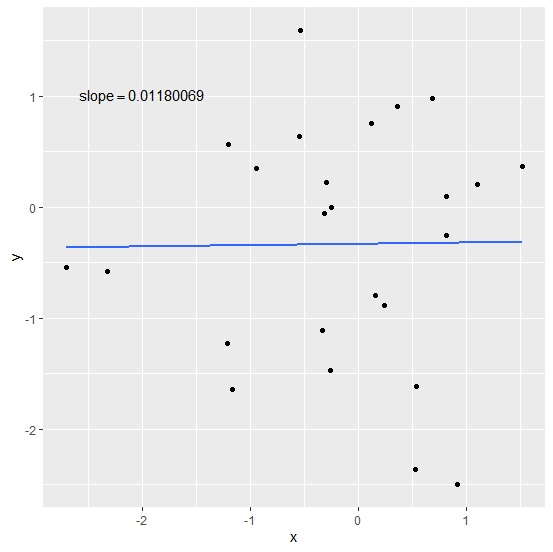
ggplot(df,aes(x,y))+geom_point()+stat_smooth(method="lm",se=F)+annotate("text",x=-
2,y=1,label=(paste0("slope==",coef(lm(df$y~df$x))[2])),parse=TRUE)
`geom_smooth()` using formula 'y ~ x'
Output
Check slope of the model
Use coeff function to find the slope of the model and check if it matches with the one displayed in the plot −
x<-rnorm(25)
y<-rnorm(25)
df<-data.frame(x,y)
coef(lm(df$y~df$x))[2]
Output
df$x
0.01180069

Updated on: 2026-03-11T22:50:58+05:30
8K+ Views

Advertisements