
Article Categories
- All Categories
-
 Data Structure
-
 Networking
-
 RDBMS
RDBMS
-
 Operating System
-
 Java
Java
-
 MS Excel
-
 iOS
iOS
-
 HTML
HTML
-
 CSS
CSS
-
 Android
-
 Python
-
 C Programming
-
 C++
C++
-
 C#
C#
-
 MongoDB
-
 MySQL
MySQL
-
 Javascript
-
 PHP
PHP
-
 Economics & Finance
Selected Reading
How to add a citation in a plot created by using ggplot2 in R?
A footnote is generally used to give references to a document, text or image and it is called citation. It helps the reader or viewer to check out the original source using the new text or image is generated. If we want to give citation to a plot in R using ggplot2 package then we can add labs that has caption option to add the footnotes.
Example
Consider the below data frame −
> set.seed(1)
> x<-rnorm(10,1.5)
> y<-rnorm(10,2.5)
> df<-data.frame(x,y)
> df
Output
      x       y
1 0.8735462 4.0117812
2 1.6836433 2.8898432
3 0.6643714 1.8787594
4 3.0952808 0.2853001
5 1.8295078 3.6249309
6 0.6795316 2.4550664
7 1.9874291 2.4838097
8 2.2383247 3.4438362
9 2.0757814 3.3212212
10 1.1946116 3.0939013
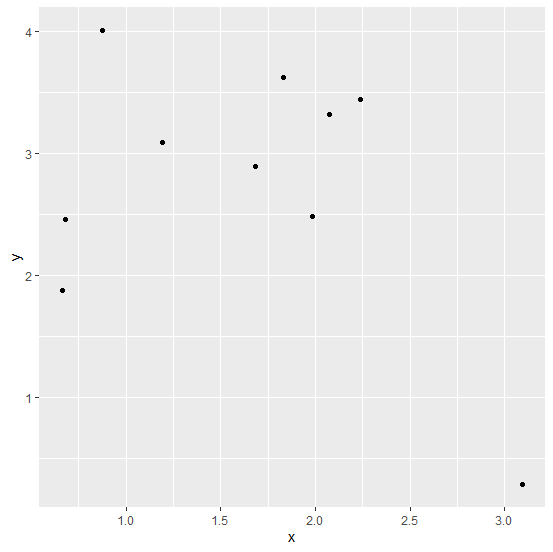
Loading ggplot2 package and creating a scatterplot between x and y −
> library(ggplot2)
> ggplot(df,aes(x,y))+geom_point()
Output
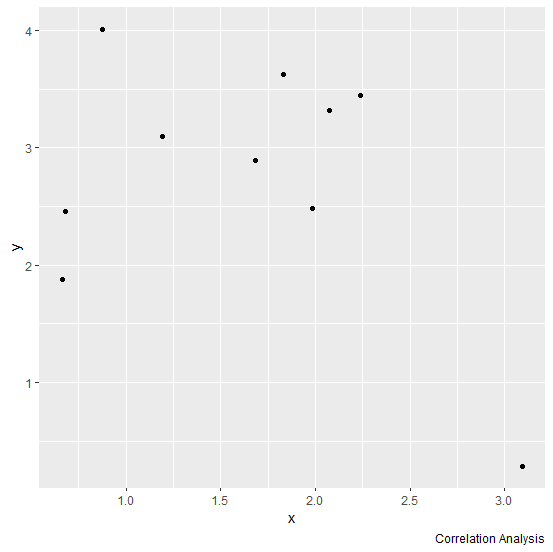
Creating the plot with footnote −
> ggplot(df,aes(x,y))+geom_point()+labs(caption="Correlation Analysis")
Output

Updated on: 2026-03-11T22:50:51+05:30
1K+ Views

Advertisements