

- Trending Categories
Data Structure
Networking
RDBMS
Operating System
Java
iOS
HTML
CSS
Android
Python
C Programming
C++
C#
MongoDB
MySQL
Javascript
PHP
- Selected Reading
- UPSC IAS Exams Notes
- Developer's Best Practices
- Questions and Answers
- Effective Resume Writing
- HR Interview Questions
- Computer Glossary
- Who is Who
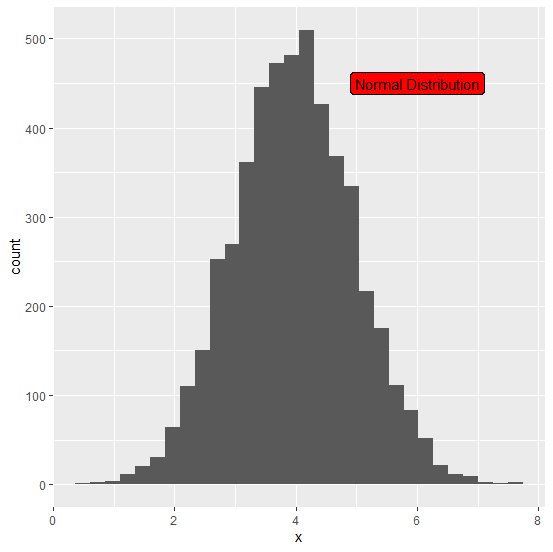
How to highlight text inside a plot created by ggplot2 using a box in R?
There might be many ways to highlight text inside a plot but the easiest one would be using geom_label function of ggplot2 package, with the help of this function we can put the required text and the aesthetics of that text by using a single line of code. It is highly recommended that we should use geom_label function with desired specifications.
Example
Consider the below data frame −
set.seed(222) x<−rnorm(5000,4,1) df<−data.frame(x) head(df,20)
Output
x 1 5.487757 2 3.998108 3 5.381021 4 3.619786 5 4.184136 6 3.753104 7 2.784439 8 5.561405 9 4.427310 10 2.798976 11 5.052458 12 2.694936 13 3.307392 14 4.602649 15 3.802247 16 2.814125 17 1.994487 18 4.007510 19 4.519490 20 3.253705 tail(df,20) x 4981 4.555400 4982 5.335003 4983 5.461943 4984 4.026777 4985 4.001629 4986 4.244421 4987 2.711058 4988 5.611044 4989 4.752044 4990 2.988279 4991 4.007473 4992 2.951105 4993 3.981081 4994 5.526550 4995 4.602384 4996 4.908750 4997 3.568487 4998 3.276785 4999 4.303017 5000 2.663639
Loading ggplot2 package and creating histogram of x with highlighted text inside the plot −
library(ggplot2) ggplot(df,aes(x))+geom_histogram(bins=30)+geom_label(aes(x=6,y=450,label="Normal Distribution"),fill="red")
Output
- Related Questions & Answers
- How to make all text size same in a plot created by using ggplot2 in R?
- How to align the text horizontally in a bar plot created by using ggplot2 in R?
- How to add a citation in a plot created by using ggplot2 in R?
- How to extract data from a plot created by ggplot2 in R?
- How to change the angle of annotated text in plot created by using ggplot2 in R?
- How to change legend values in a bar plot created by using ggplot2 in R?
- How to display regression intercept using model in a plot created by ggplot2 in R?
- How to display regression slope using model in a plot created by ggplot2 in R?
- How to add a horizontal line to the plot created by ggplot2 in R?
- How to plot means inside boxplot using ggplot2 in R?
- How to remove the boxes around legend of a plot created by ggplot2 in R?
- How to create horizontal line for a range of values in a plot created by using ggplot2 in R?
- How to save a plot as SVG created with ggplot2 in R?
- How to put the plot title inside the plot using ggplot2 in R?
- How to write text outside plot using ggplot2 in R?
Advertisements