- Trending Categories
Data Structure
Networking
RDBMS
Operating System
Java
MS Excel
iOS
HTML
CSS
Android
Python
C Programming
C++
C#
MongoDB
MySQL
Javascript
PHP
Physics
Chemistry
Biology
Mathematics
English
Economics
Psychology
Social Studies
Fashion Studies
Legal Studies
- Selected Reading
- UPSC IAS Exams Notes
- Developer's Best Practices
- Questions and Answers
- Effective Resume Writing
- HR Interview Questions
- Computer Glossary
- Who is Who
How to change the Y-axis title to horizontal using ggplot2 in R?
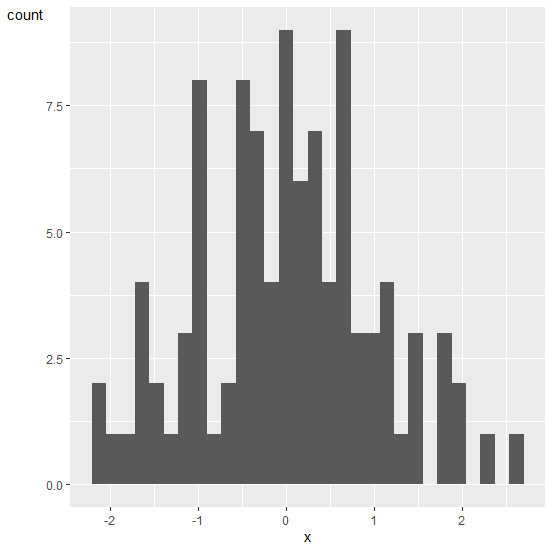
The default direction of Y-axis title using ggplot2 in R is vertical and we can change to horizontal. For this purpose, we can use theme function of ggplot2 package. We would need to use the argument of theme function as axis.title.y=element_text(angle=0)) and this will write the Y-axis title to horizontal but the position will be changed to top.
Example
Consider the below data frame −
x<−rnorm(100) df<−data.frame(x) head(df,20)
Output
x 1 −0.5417569 2 −0.4018531 3 0.2178570 4 1.1911282 5 0.5977775 6 0.5790850 7 −0.5143645 8 0.5056482 9 1.1791990 10 −0.2668907 11 −0.4142607 12 −0.3763989 13 0.6037290 14 −0.4162111 15 −0.1434954 16 1.9538955 17 0.2724839 18 1.7957378 19 1.9833760 20 −0.9305919
Loading ggplot2 package and creating a histogram of x −
Example
library(ggplot2) ggplot(df,aes(x))+geom_histogram(bins=30)
Output
Changing the Y−axis title direction to horizontal −
Example
ggplot(df,aes(x))+geom_histogram(bins=30)+theme(axis.title.y=element_text(angle=0))
Output
- Related Articles
- How to change the text size of Y-axis title using ggplot2 in R?
- How to change the adjustment of the plot title using ggplot2 to align it above the Y-axis labels in R?
- How to change the Y-axis title in base R plot?
- How to change the Y-axis values in a bar plot using ggplot2 in R?
- How to change the Y axis limit for boxplot created by using ggplot2 in R?
- How to change the legend title in ggplot2 in R?
- How to change the title size of a graph using ggplot2 in R?
- How change the color of facet title using ggplot2 in R?
- How to set the Y-axis tick marks using ggplot2 in R?
- How to change the gridlines of Y-axis on a chart created by using ggplot2 in R?
- How to display 0 at Y-axis using ggplot2 in R?
- How to write partial title of X-axis in italics using ggplot2 of R?
- How to change the color of X-axis label using ggplot2 in R?
- How to display Y-axis with Euro sign using ggplot2 in R?
- How to change ordinal X-axis label to text labels using ggplot2 in R?

Advertisements