
Article Categories
- All Categories
-
 Data Structure
-
 Networking
-
 RDBMS
RDBMS
-
 Operating System
-
 Java
Java
-
 MS Excel
-
 iOS
iOS
-
 HTML
HTML
-
 CSS
CSS
-
 Android
-
 Python
-
 C Programming
-
 C++
C++
-
 C#
C#
-
 MongoDB
-
 MySQL
MySQL
-
 Javascript
-
 PHP
PHP
-
 Economics & Finance
How to add minor gridlines in an Excel chart?
In most cases, the horizontal gridlines that should be included in a column chart, bar chart, or line chart will be inserted automatically. However, there are situations when you would wish to reduce the spacing between the gridlines, as illustrated in the picture below; how can you do this? Excel makes it possible to include additional minor gridlines in a column, bar, or line chart.
Step 1
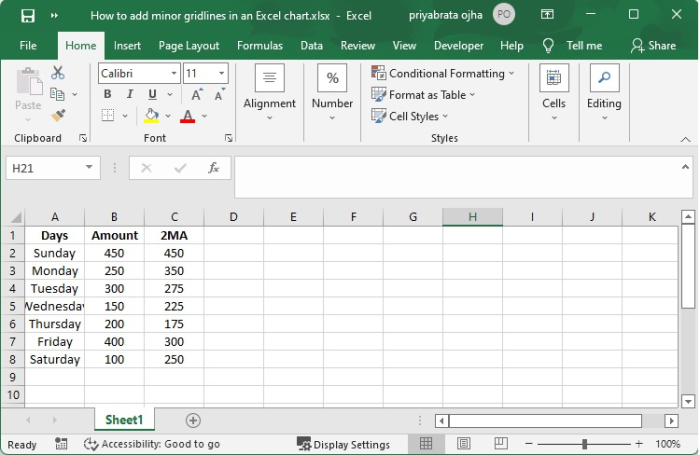
You are going to learn how to add minor gridlines to a line graph by looking at this little example. In order to get it done,
Step 2
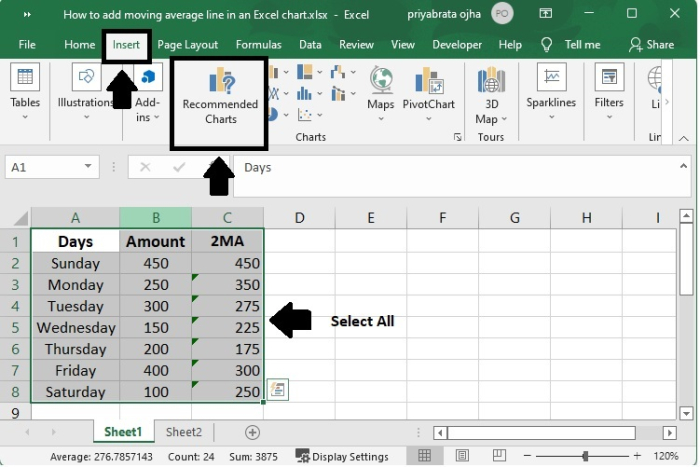
Choose the data from the source, being sure to include the Average column (A1:C8).
Click Recommended Charts by going to the Insert tab, then clicking on the Charts group.
Step 3
Step 4
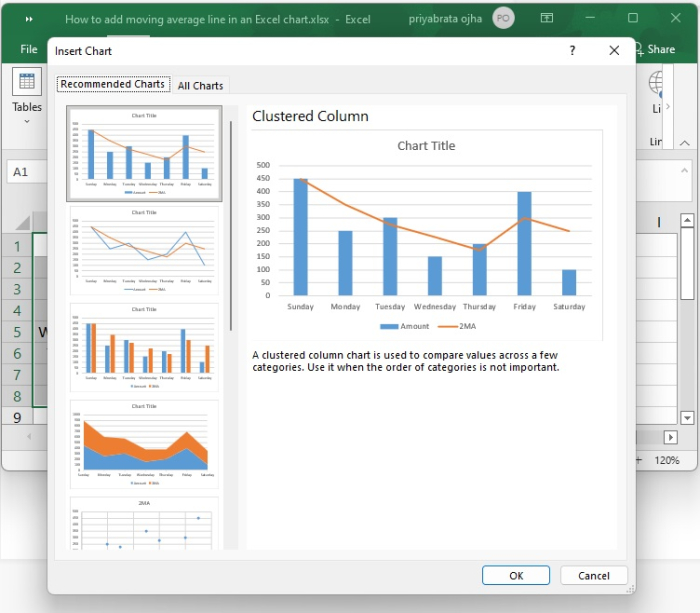
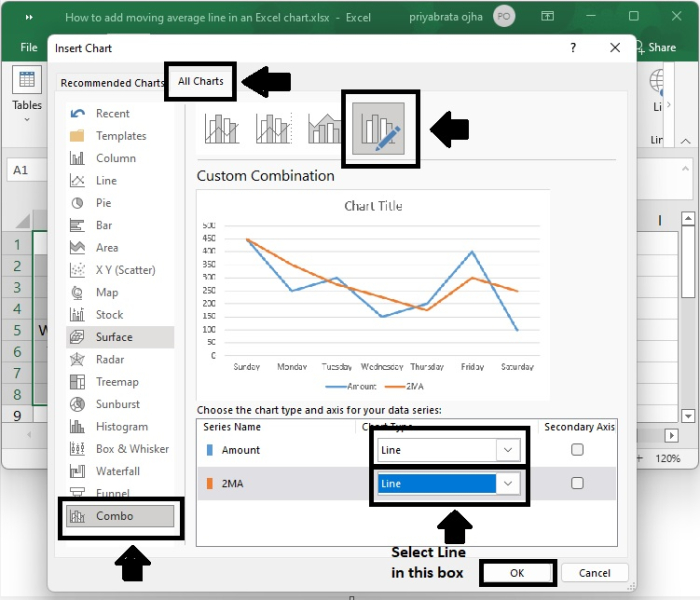
Click the All Charts tab, then choose the Clustered Column - Line template, and then click the OK button.
If none of the standard combination charts meet your requirements, you may pick the Custom Combination type (the final template with the pen icon), and then choose the appropriate type for each of th data series.
Step 5
You have developed a line chart with significant horizontal gridlines, similar to the one seen in the picture below. Now that you are here, you may follow the instructions below to adjust it such that the line chart has minor horizontal gridlines.
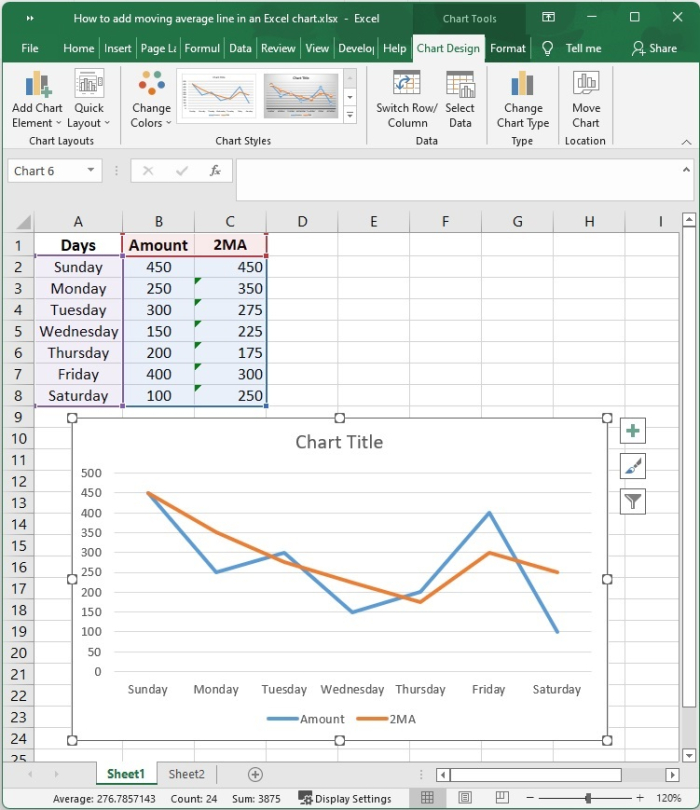
Step 6
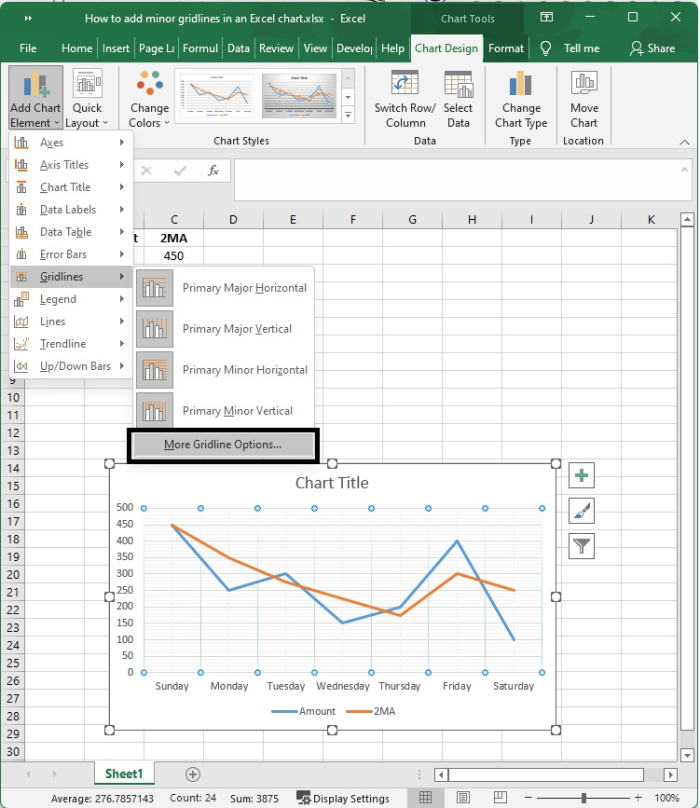
Simply click in the area of the chart where you would want the chart gridlines to appear.
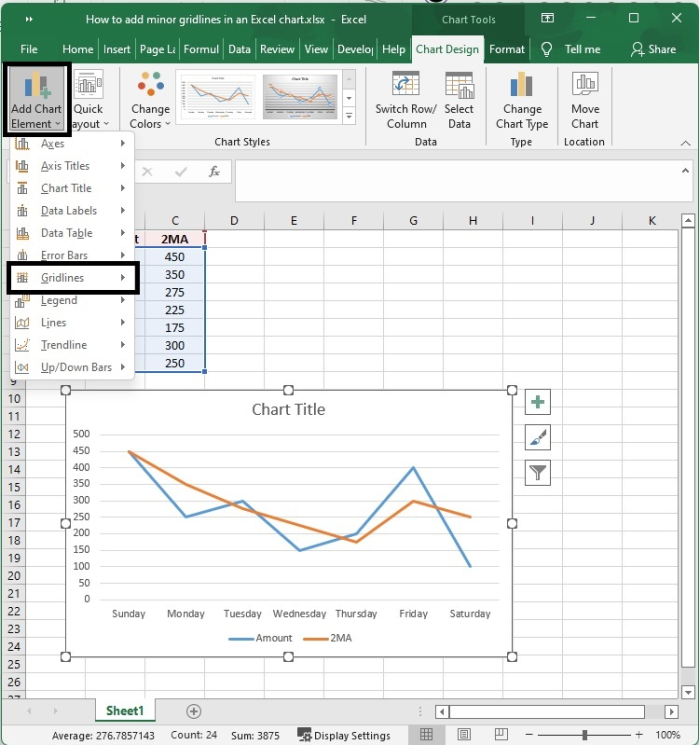
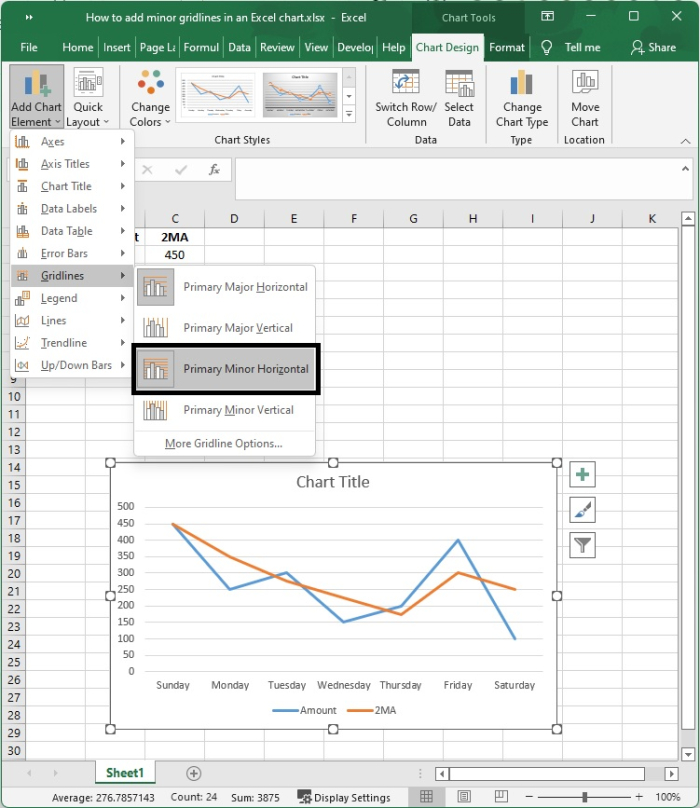
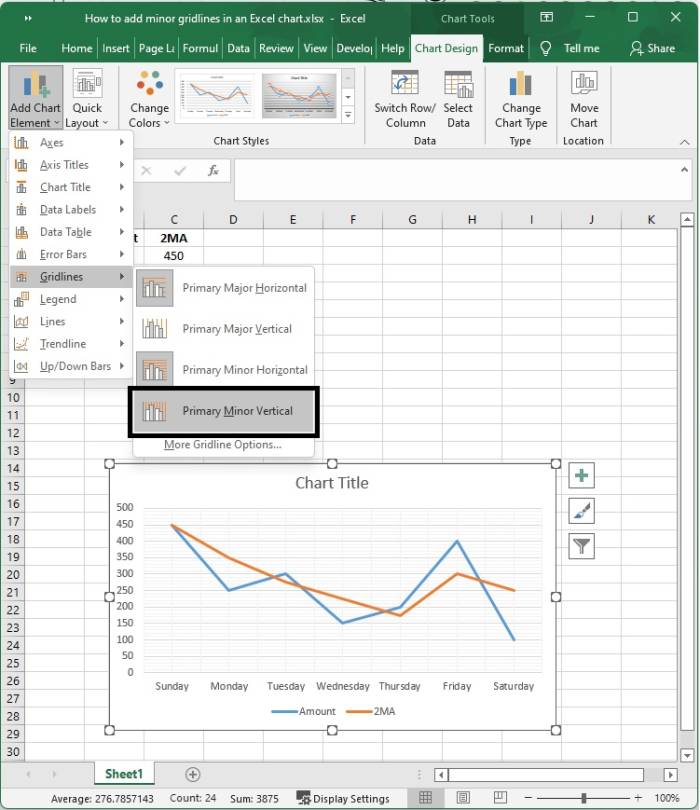
Choose the Add Chart Element button located in the Chart Layouts group on the Design tab. Next, point to Gridlines and then click the gridline choice that you wish to show. You may see a preview of the gridline display by moving the mouse cursor over each choice and leaving it there.
Step 7
Primary Minor Horizontal ?
Primary Minor Vertical ?
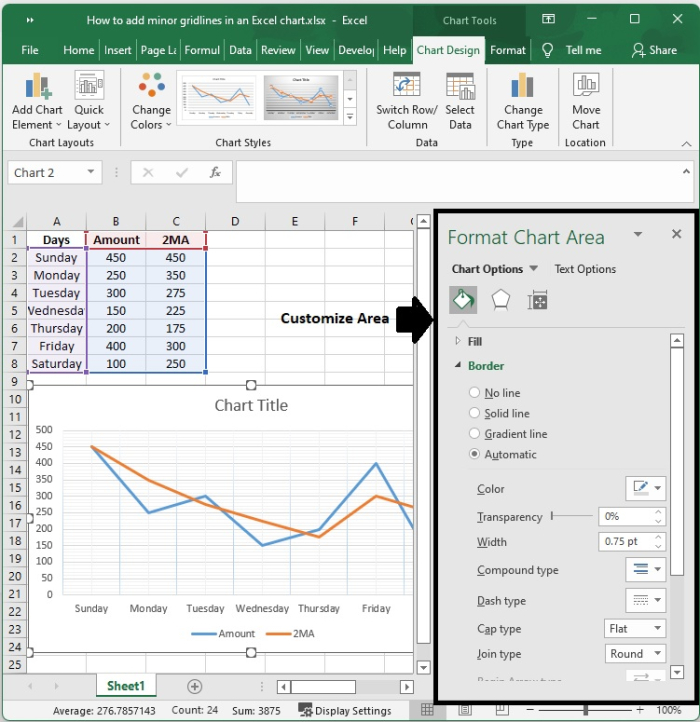
More Guideline Options ?
Customize Section ?
Conclusion
In this tutorial, we explained how you can add different types of gridlines in an Excel chart.

3K+ Views
