
Article Categories
- All Categories
-
 Data Structure
-
 Networking
-
 RDBMS
RDBMS
-
 Operating System
-
 Java
Java
-
 MS Excel
-
 iOS
iOS
-
 HTML
HTML
-
 CSS
CSS
-
 Android
-
 Python
-
 C Programming
-
 C++
C++
-
 C#
C#
-
 MongoDB
-
 MySQL
MySQL
-
 Javascript
-
 PHP
PHP
-
 Economics & Finance
How to Remove Gridlines From Chart in Excel?
In order to present data in a clear and straightforward manner, Excel is a strong tool for making visually appealing charts and graphs. However, Excel automatically includes gridlines, which are horizontal and vertical lines that aid in visually matching data points, in charts. While gridlines can occasionally be helpful, there are times when you might wish to eliminate them to make a chart look cleaner and more polished.
We can help you whether you're working with a straightforward combo chart, a bar chart, or a line chart. By the end of this session, you'll be equipped with the skills and confidence to refine your Excel charts, making them more appealing and suited to your particular requirements. Let's go to work on figuring out how to make an Excel chart without gridlines!
Remove Gridlines From Chart
Here we will look at two methods to complete the task. So let us see a simple process to learn how you can remove gridlines from a chart in Excel.
Method 1
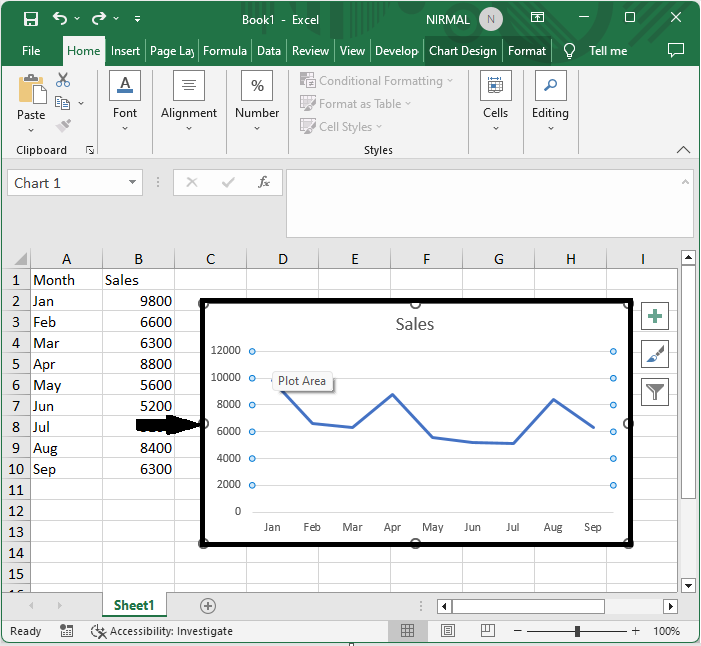
Consider an Excel sheet where you have grid lines.
The first method is to use the delete button.
Click on any grid line except the first line and click the Delete button to complete the task.
Grid Line > Delete
Method 2
The second method is by formatting the chart.
First, click on the chart, then on Layout, then on Add chart elements, then on Gridlines, and select vertical or horizontal gridlines to remove the lines.
Chart > Layout > Add Chart Elements > Grid Lines > Vertical or Horizontal

This is how you can remove gridlines from a chart in Excel.
Conclusion
In this tutorial, we have used a simple example to demonstrate how you can remove gridlines from a chart in Excel to highlight a particular set of data.

510 Views
